Highlights From The Comments On Piketty
Chris Stucchio recommended Matt Rognlie’s criticisms of Piketty (paper, summary, Voxsplainer).
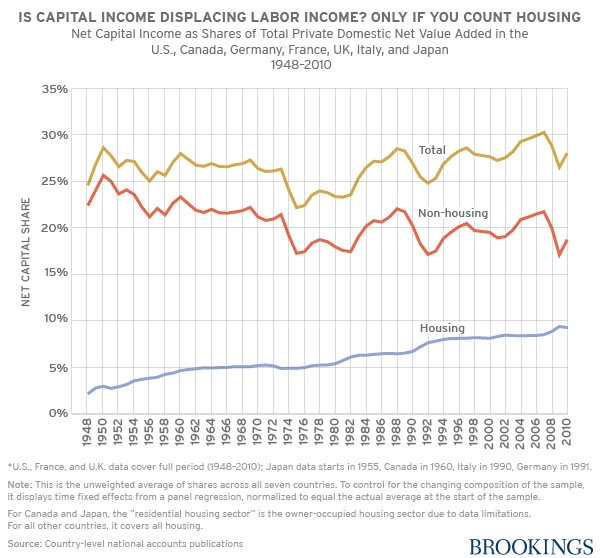
Rognlie starts by saying that Piketty didn’t correctly account for capital depreciation (ie capital losing value over time) in his calculations. This surprises me, because Piketty says he does in his book (p. 55) but apparently there are technical details I don’t understand. When you do that, the share of capital decreases, and it becomes clear that 100% of recent capital-share growth comes from one source: housing.
 I can’t find anyone arguing that Rognlie is wrong. I do see many people arguing about the implications, all the way from “this disproves Piketty” to “this is just saying the same thing Piketty was”.
I think it’s saying the same thing Piketty was in that housing is a real thing, and if there’s inequality in housing, then that’s real inequality. And landlords are a classic example of the rentiers Piketty is warning against.
But it’s saying a different thing in that most homeowners use their homes by living in them, not by renting them out. That means they’re not part of Piketty’s rentier class, and so using the amount of capital to represent the power of rentiers is misleading. Rentiers are not clearly increasing and there is no clear upward trend in rentier-vs-laborer inequality. I think this does disprove Piketty’s most shocking thesis.
Rognlie also makes an argument for why increasing the amount of capital will decrease the returns on capital, leading to stable or decreasing income from capital. Piketty argues against this on page 277 of his book, but re-reading it Piketty’s argument now looks kind of weak, especially with the evidence from housing affecting some of his key points.
Grendel Khan highlights the role of housing with an interesting metaphor:
Did someone say housing?
As an illustration, the median homeowner in about half of the largest metros made more off the appreciation of their home than a full-time minimum-wage job. It’s worst in California, of course; in San Jose, the median homeowner made just shy of $100 per working hour.
See also Richard Florida’s commentary. See also everything about how the housing crisis plays out in micro; it is precisely rentier capitalism.
In the original post, I questioned Piketty’s claim that rich people and very-well-endowed colleges got higher rates of return on their investment than ordinary people or less-well-endowed colleges. After all, why can’t poorer people pool their money together, mutual-fund-style, to become an effective rich person who can get higher rate of return? Many people tried to answer this, not always successfully.
brberg points out that Bill Gates – one example of a rich person who’s gotten 10%+ returns per year – has a very specific advantage:
Not sure about Harvard’s endowment, but it’s worth noting that the reason Gates, Bezos, Zuckerberg, and other self-made billionaires have seen their fortunes grow so quickly is that each of them has the vast majority of their wealth invested in a single high-growth company.
This is an extremely high-risk investment strategy that has the potential to pay off fantastically well in a tiny percentage of cases, but it’s not really dependent on the size of the starting stake. Anyone who invested in Microsoft’s IPO would have seen the same rate of return as Gates.
This is a good point, but most of Piketty’s data focuses on college endowments. How do they do it?
Briefling writes:
I’m not sure you can take the wealth management thing at face value. The stock market since 1980 has 10% annualized returns. Instead of trying to replicate whatever Harvard and Yale are doing, why don’t you just put your money in the stock market?
Also a good point, but colleges seem to do this with less volatility than the stock market, which still requires some explanation.
Tyrathalis, a financial planner, adds more information:
One of the things that having /any/ major financial planner does for you, though, is it opens up access to private equity funds that are only advertised to sufficiently high-net-worth individuals and businesses. The primary asset class that super high gains come from is private equity, generally meaning investments in angel funds and off-market startups. The way these funds operate involves you pledging a certain amount of money that they can invest as they choose, but they only call up parts of it periodically. This means that dealing with a few really rich people is much easier than dealing with a ton of poor people, in particular because it is really, really bad if they can’t manage to get all of the money. Their current business model requires only dealing with people who will definitely be able to make their payments when they need to, and since the funds are so large, that means they need to have a few very rich investors. Investment advisors known to advise large fortunes are where they go to find those people.
Also, any given private equity fund is still likely to make a negative return, which is a much bigger deal if you don’t have a lot of money in the first place, so very few people would recommend that you invest in a private equity fund instead of something safer if you aren’t already rich. Higher returns implies higher standard deviation. That’s also why a long time horizon is so significant. The basic activity of asset class investing is to diversify to balance out high variability without diminishing returns too much, but over a long enough time frame the variability matters much less and you can afford to make riskier investments.
Although, getting 10% returns doesn’t require any special connections. The stock market grows at 11% a year, it just has very high variability, so you need to be able to be in the market for several decades to ensure those gains with an all-stock portfolio. A 60/40 split of stocks and bonds will get around 8%, while not requiring more than a few dollars to invest. You can do it on Schwab with only a bit of research. The reason why super rich people and organizations /only/ get 10% returns is that despite private equity managing 20% or more, even they don’t have enough capital and long enough time horizons to stay fully invested in such risky markets. They diversify heavily too, cutting returns in favor of making those returns basically guaranteed.
My main point is that financial planners do things besides stock picking, but one of the things they do is get you into private equity funds, which are the main source of the better returns that rich people can get. However, for reasons of risk management, this isn’t something people who aren’t super rich necessarily ought to imitate. There are only slightly less effective strategies that anyone could imitate, but its not smart for everyone to have the same amount of risk. Realistically, most people ought to do something like the 60/40 split I mentioned, and the difference between that and what most people end up getting is due to people being bad at performing optimal strategies even when they know what they are.
And Vaniver adds:
There’s a mutual fund called the Magellan Fund, which was famous for its extreme performance (I believe it was annual growth of 15-20% per year) for about 20 years.
At the end of that streak, someone ran the numbers and discovered that most of the people who had invested in the fund had lost money, because they bought in when the market was high and sold when the market was low.
The problem that mutual funds have is that they don’t know how much money they’re going to have tomorrow, because there are thousands upon thousands of customers who might want some of their money back, or might want to add in some more money, and as a result there are lots of unplanned trades they’ll have to make that only benefit their customers, not them. Many of the best managers insist on terms of the form “you give me money and then can’t take it out for N years” so that they don’t have to deal with this kind of thing (in the short term, at least).
For private equity servicing one large customer, there are far fewer moves of that form, and they’re much easier to predict, and you averaging across many small customers still doesn’t duplicate that effect.
I still don’t feel like this explains everything; surely a college with $500 million has about the same risk tolerance and ability to give money on the right time scale as a college with $1 billion? Maybe all of this is just false? J Mann writes:
Is it consensus that Harvard and Yale consistently get better returns than other endowments and than the market? It looks like Harvard at least has had a number of recent bad years, and that some people are suggesting that its results may be based on taking on more risk.
And Anon256 adds:
Indeed; Havard has done badly enough in the years since Piketty’s book was published that it’s now considering switching to just using index funds.
And Will4071 says:
Just to note, I don’t think large endowments/the very rich really do anything special. This analysis suggests that they actually underperform a levered 60/40 portfolio (which is fairly standard, and something you could easily set up yourself).
Chris Stucchio has a different perspective on rich people making higher rates of return:
It’s also worth reflecting on a point which Piketty makes mathematically, but literally never says in words. If rich people are the best investors, then the best way to create economic growth is to ensure that rich people are the ones controlling investment decisions. Intuitively this makes a lot of sense; Travis Kalanick (and now Dara “the D” Khosrowshahi) are a lot better at transportation than the average autowale. Bezos is a lot better at logistics than my local cell phone store.
See also Paul’s answer to one of my objections to this. Right now it looks like (assuming Piketty is right about this at all), Chris has a point. Does anyone want to try to convince me otherwise?
Phillip Magness, himself an economic history professor, writes:
I’d also urge you to look more skeptically on his income distribution stats (the figure 1.1 above). Several economists, myself included, have been working on the measurement problems that arise from attempting to determine income shares from tax data in recent years. The aforementioned figure comes from a 2003 study by Piketty and his coauthor Emmanuel Saez. While it represented an innovative contribution to the literature, this paper gives generally insufficient treatment to the effect of changes to the tax code itself upon data that derive from income tax reporting.
To put it another way, taxpayers – both wealthy and poor – respond to the way that income tax laws are structured so as to minimize their own tax burdens. They take advantage of incentives and loopholes to lower what they owe. They engage in wealth planning strategies to legally shelter income from high rates of taxation. And some even illegally evade their obligations by misreporting income.
Tax avoidance and evasion rates vary substantially over time and in response to tax code changes, and so do the statistics they generate with the IRS. A major problem in Piketty-Saez is that they do very little to account for this issue over time, and instead simply treat tax-generated stats as if they are representative. Doing so yields a relatively sound measurement of income distributions, provided that the tax code remains relatively stable over long periods of time (e.g. what the U.S. experienced between roughly 1946 and 1980). When the tax code undergoes frequent and major changes though, tax-generated stats become less reliable. And it just so happens that the two periods of “high” inequality on the Piketty-Saez U-curve are also periods of volatility in the tax code: 1913-1945 and 1980-present.
The 1913-45 period is marred by both frequent tax rate swings and an initially small tax base that was rapidly expanded during WWII, combined with the introduction of automatic payroll withholding in 1943. When you account for these and related issues, the extreme inequality of the early 20th century and especially the severe drop it undergoes between 1941-45 become much more subdued. The period from 1980-present is similarly marred by Piketty and Saez’s failure to fully account for the effects of the Tax Reform Act of 1986, which induced substantial income shifting at the top of the distribution to take advantage of differences between the personal and corporate tax rates. Adjusting for that has a similar effect of lowering the depicted rebound.
Taken together, what we’re probably experiencing is a much flatter trend across the 20th century – one that resembles a tea saucer rather than a pronounced U. And that has profound implications for Piketty’s larger prescriptive argument in favor of highly progressive tax rates.
Magness also recommends his 2014 paper and Richard Sutch’s 2017 conceptual replication questioning Piketty’s data. It’s inherently hard to find good data on inequality over the last few centuries, but Magness finds that of the many datasets available, Piketty cherry-picked the ones that best fit the u-shaped curve he wanted to show, estimated some missing data points kind of out of thin air, and made some other questionable decisions. The result is a much less pronounced change in inequality, especially in the US.
The paper is pretty confrontational (on his own blog, Magness’ co-author describes Piketty as making “no-brainers…boneheaded historical errors [that] would be shocking if contained in a high school term paper”. Piketty sort of says a few words in his own defense in this article. But one thing I notice is that it looks like, aside from these authors, everyone is working together on this – the author of one of the pro-Piketty datasets was also a co-author of one of the anti-Piketty datasets, and the author of one of the anti-Piketty datasets has worked with Piketty in the past. This suggests to me that a lot of this is legitimately hard and that the same people, working from different methods, get different results. My main takeaway is that there are many different inequality datasets and Piketty used the most dramatic.
Tlaloc on the Discord provides the European log GDP graphs I wanted:

I think it’s fair to ask – what the heck? Taken literally, doesn’t this suggest WWII was long-run good for Europe – that its “recovery” brought it well above trend?
Eyeballing the Maddison Project data elsewhere shows France, Germany, and the US all having very similar growth of 200% between 1960 and 2016.
I need to look into this more, but right now I’m not really buying it.
VPaul doesn’t believe in straight-line GDP growth anyway:
I don’t trust inflation statistics, so I don’t trust inflation adjusted GDP statistics. During the time period covered by Piketty’s GDP growth trend line, there have multiple different methodologies for measuring inflation, with adjustments to fix obvious errors in previous versions of inflation adjusters. Since we know inflation statistics have been wrong, and there is good evidence they are still wrong, I think the steady GDP growth rate is an artifact.
Several people point out that “increasing number of rentiers” is not necessarily bad; after all, this is what the post-scarcity robot future should look like. For example, from Virriman:
A world where 1% of people can avoid drudgery seems preferable to a world where only 0.1% can do that, holding everything else equal. Isn’t the techno-utopian ideal a world where almost everyone is a “rentier”?
Sounds like we need to figure out how to get back to the gilded age, and then figure out how to turn that 1% of rentiers into 2% and keep trying to expand that number.
This could maybe make sense around number of rentiers, but amount of money per rentier could work the opposite direction, and Piketty’s numbers awkwardly combine both.
Paul Christiano on some of Piketty’s other statistics:
The extrapolation in figure 10.11 looks pretty wild. It takes a special something to draw a graph that’s been pretty smooth/predictable historically, then insert a stark+unprecedented regime change exactly at the current moment for no apparent reason. Does he give some justification for the sharp discontinuity?
Claiming that economic growth is always 1-1.5% also seems pretty dubious. According to Maddison’s estimates, which I don’t think are under dispute, worldwide per capita growth first reached 1% around 1900, continued increasing to 2-3% by 1960, and then fell back down to 1% in the great stagnation. You could say “A century is a long time, that’s basically always, the mid-century spike was just a deviation” but elsewhere Pikkety seems willing to write off that same chunk of history as an aberration. Or maybe his argument is supposed to apply only to the US? (Or maybe he includes Europe and then can cite steady growth for 150 years instead of 100? I don’t even think that’s true though, in 1875 I think that per capita GDP growth in Europe was not yet 1%?)
I’m not sure in what sense rentiers can be said to be winning. We can just look directly and see that rents are significantly smaller than wages, the capital share of income is staying around 1/3, it’s grown but only a tiny bit. If 1/3 of GDP is rents that get allocated inequitably then maybe you can increase median income by 25% with perfect redistribution, but that just doesn’t seem that promising compared to efficiency effects, unless you are super concerned about inequality per se (rather than regarding it as an opportunity to benefit poorer people). Even that benefit would shrink as savings rates fall.
If in fact the rentiers grow their fortunes at r, then they will get wealthier and wealthier until r = g, that’s basically an accounting identity. That seems to basically be a reductio of the concern that r>>g can continue indefinitely + rentiers can have their wealth grow at the rate r.
From an efficiency standpoint it seems like the main implication of r>>g is that we could spend 1% of GDP today to make our descendants several percent richer, which sounds like a good deal and suggests that we ought to invest more. It’s pretty wild to respond to r>>g by considering massively disincentivizing investment. If you want to push for equality and think that r>>g, maybe support a sovereign wealth fund? Or else we’d need to decide collectively whether the problem with inequality is that some people are rich, or that other people are poor—I can see how a wealth tax (vs a similarly large consumption or income tax) would help with one of those problems, but not the other. I think it’s just a really bad policy for a lot of reasons with very little to recommend it other than leveling down.
Swami brings up an IGM poll of economists on r>>g:
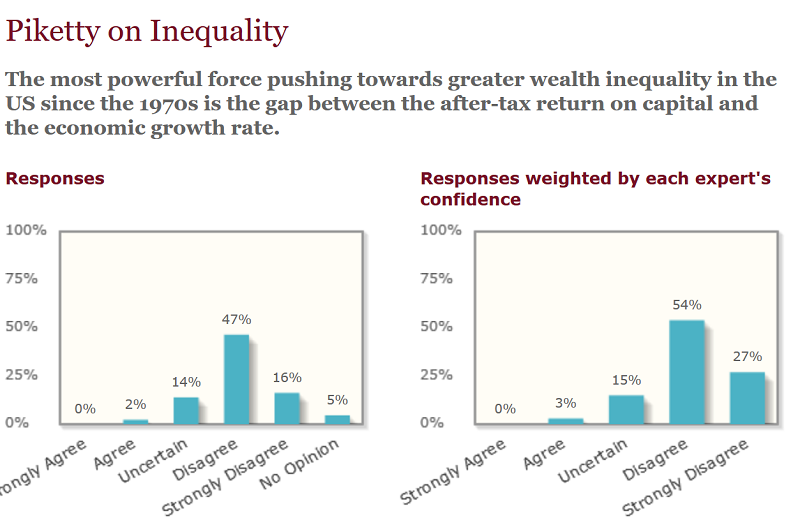 ADifferentAnonymous counters with a Matt Yglesias article arguing that this isn’t really disproving anything Piketty is saying.
Overall, it looks like the claim that the super-rich get much better returns on investment than everyone else doesn’t really hold up, except in obvious predictable ways, eg they can take more risks.
The claim that there is a rising rentier class who will dominate the 21st century doesn’t really hold up.
I’m not qualified to say whether Piketty’s empirical data holds up, but there seems to be significant academic debate over it.
And although Piketty’s rules of thumb for growth (g = 1 – 1.5%, r = 4-5%) hold up more than I would have expected before reading him, they still don’t hold up that well.
Now taking recommendations about if anything from Piketty is still worth keeping.