SSC Survey 2017 Results
[None of these calculations were really double-checked and some of them might be wrong. If you’re really interested in accuracy, download the raw data at the bottom and see for yourself.]
I.
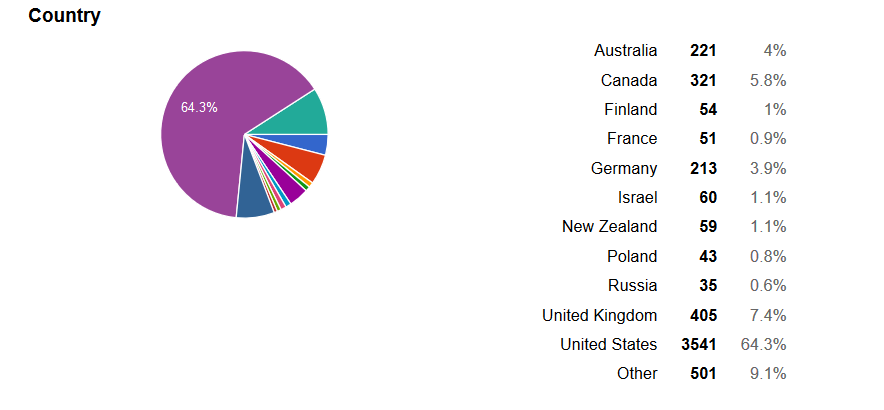
Back in January I asked you to take the SSC survey. Thanks to the 5,500 (!) people who sent in responses. Below are some summaries of answers, alongside paraphrases of the relevant questions to jog your memory. If you want to see the actual questions (some of which are long) you can read them on the survey here. Please don’t try to take the survey; your answers will be ignored.
“What country are you from?”
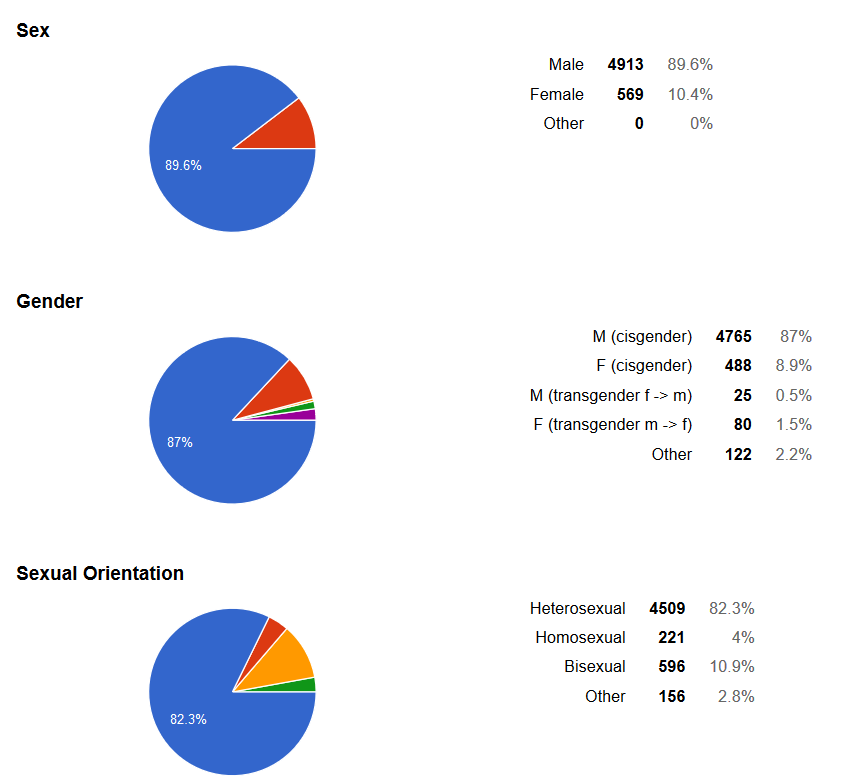
“What is your biological sex?”
“What is your gender?”
“What is your sexual orientation?”
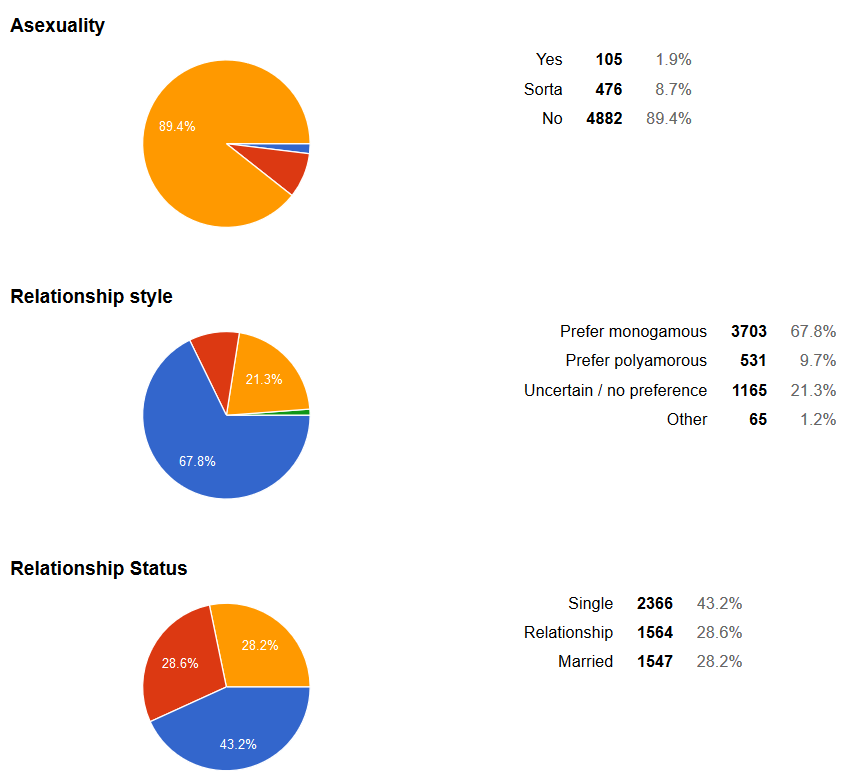
“Do you identify as asexual?”
“Do you prefer monogamous or polyamorous relationships?”
“Are you currently in a relationship?”
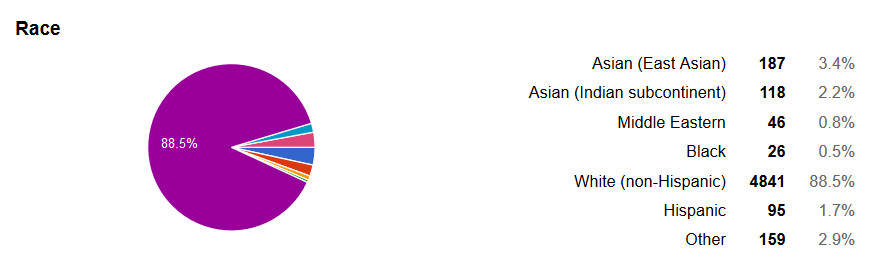
“As what race do you most identify?”
“What is the highest level of education you completed?”
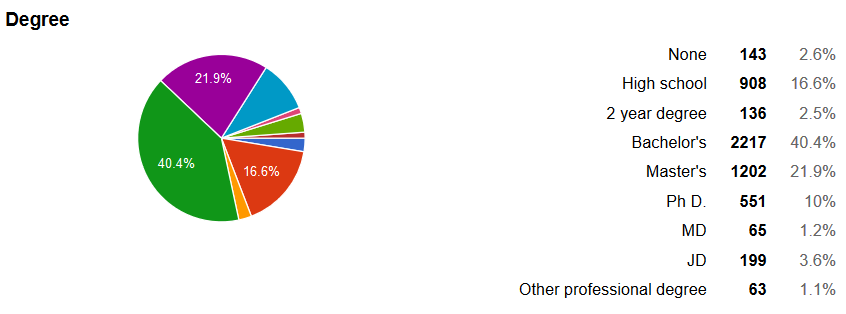
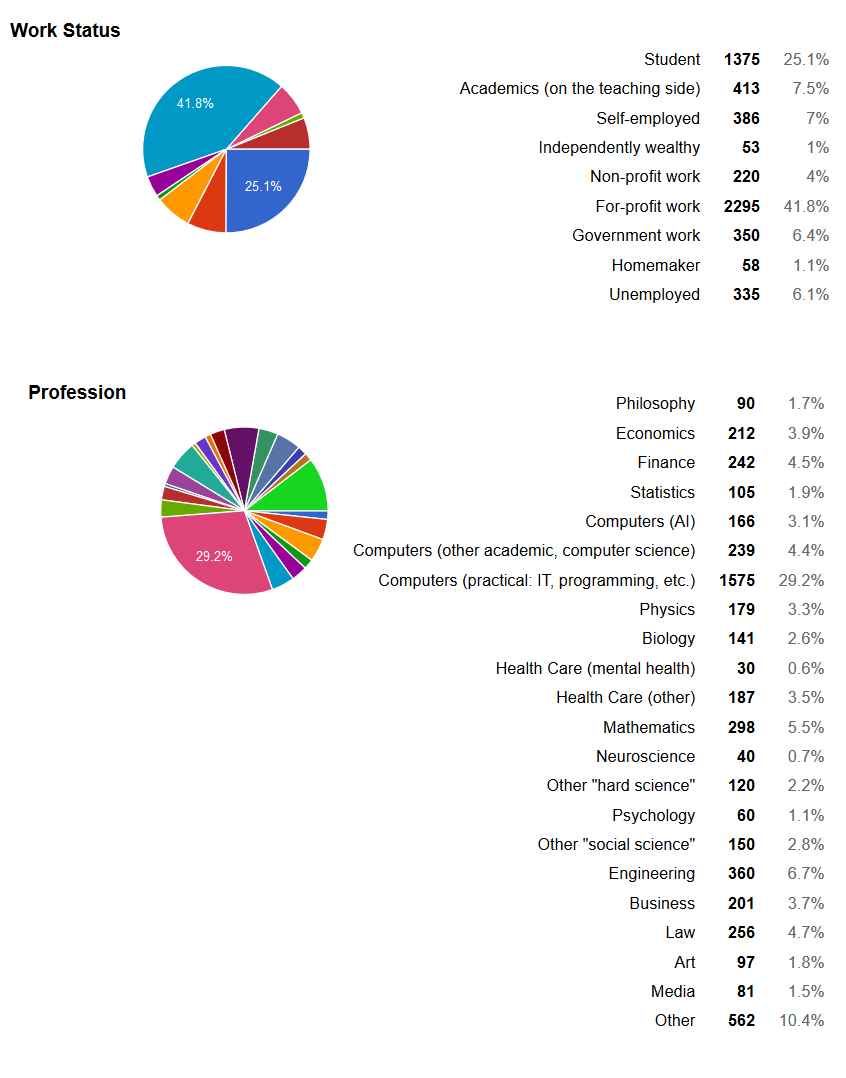
“What is your current employment status?”
“In what field do you work or study?”
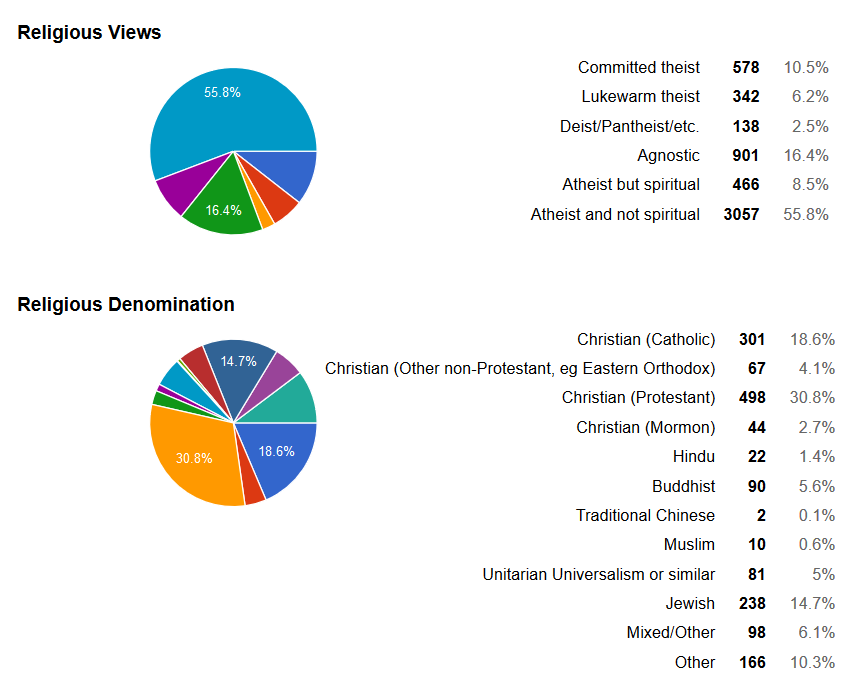
“How would you describe your religious views?”
“If you believe in a religion, which religion is it?”
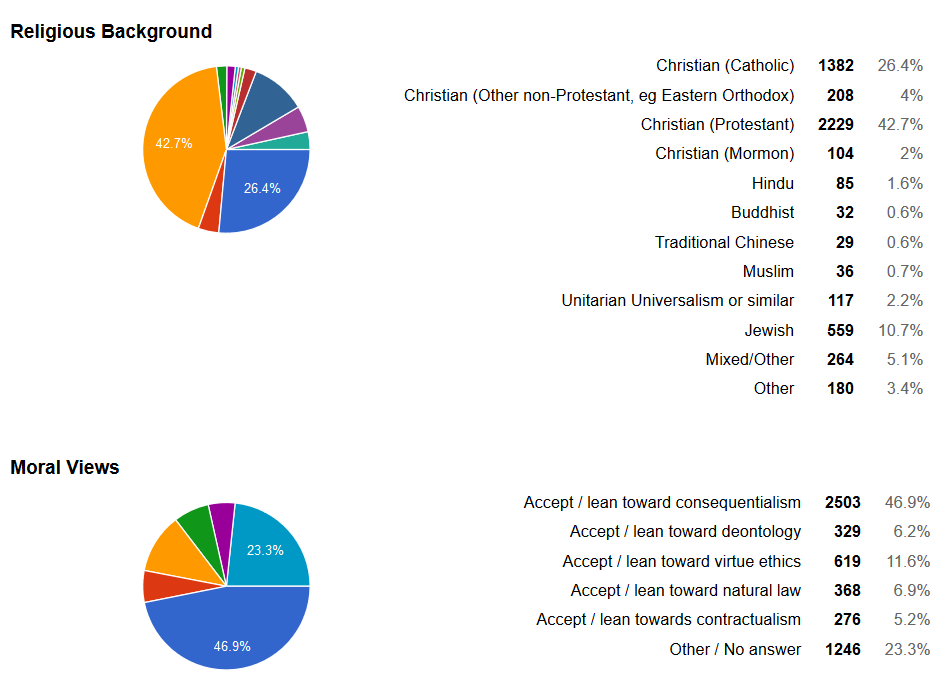
“Whether or not you believe it, what is the religious background of your family?”
“What are your ethical views?”
“How long have you been reading Slate Star Codex?”
“How many of the 750 or so Slate Star Codex posts have you read?”
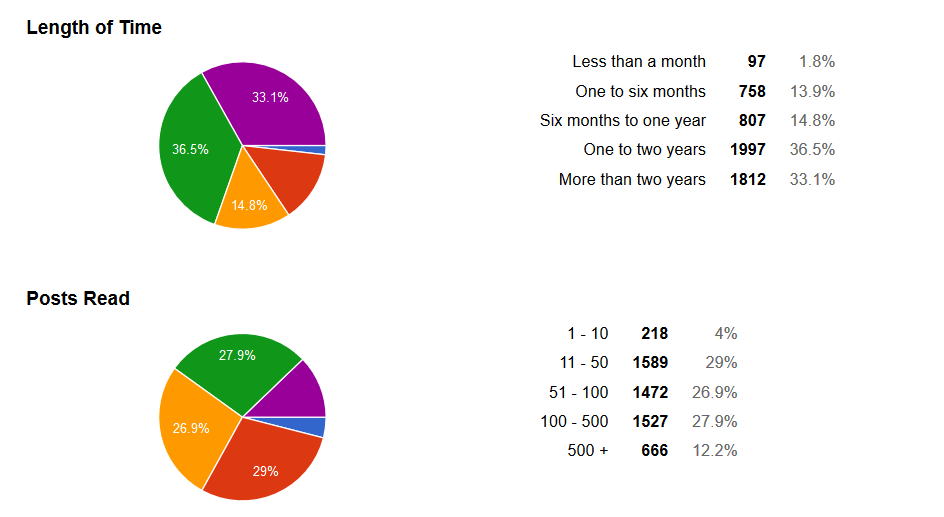
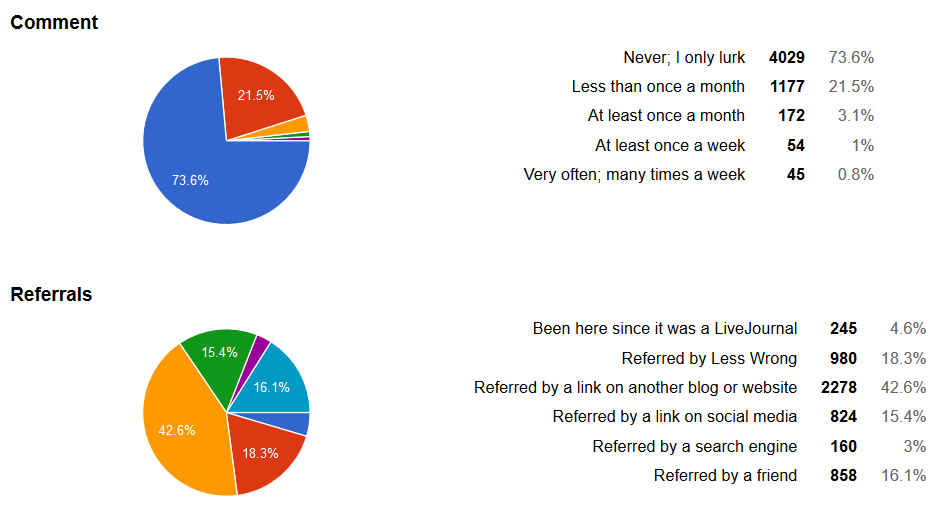
“How often do you comment on Slate Star Codex?”
“How were you referred here?”
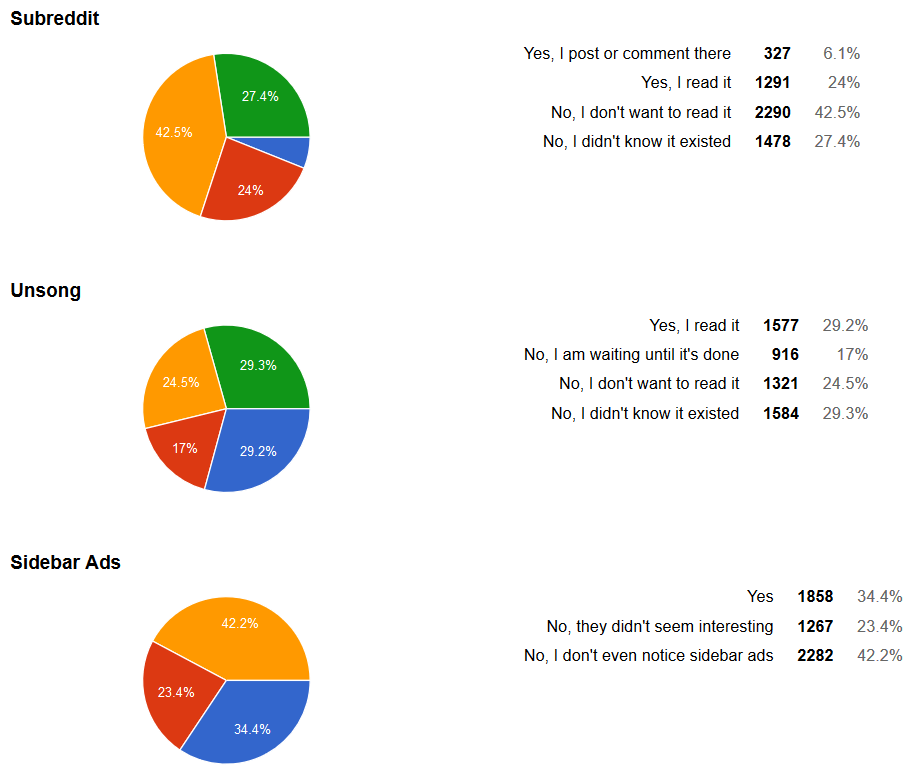
“Do you read the SSC subreddit?”
“Do you read Unsong?”
“Have you ever clicked on the sidebar ads?”
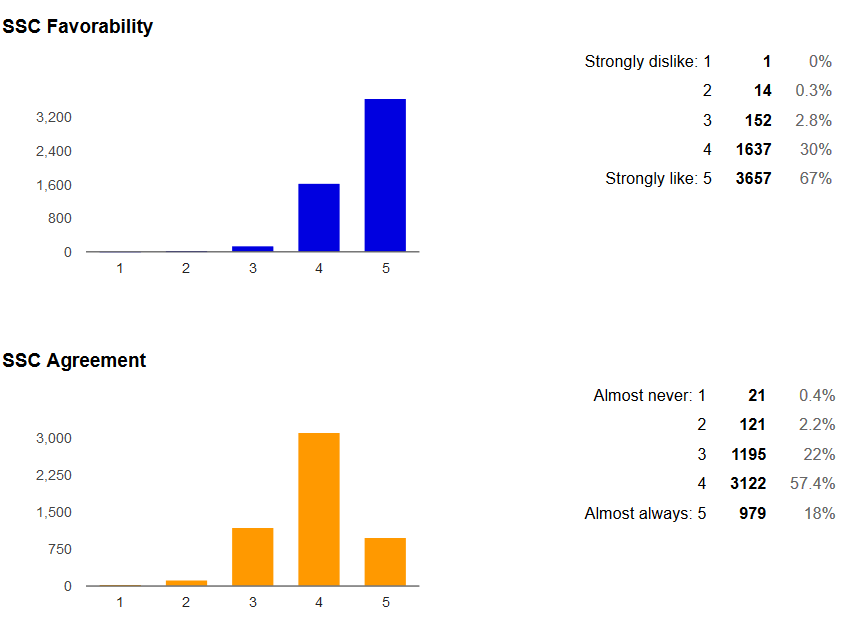
“How much do you like SSC?”
“How often do you agree with the object-level points SSC makes?”
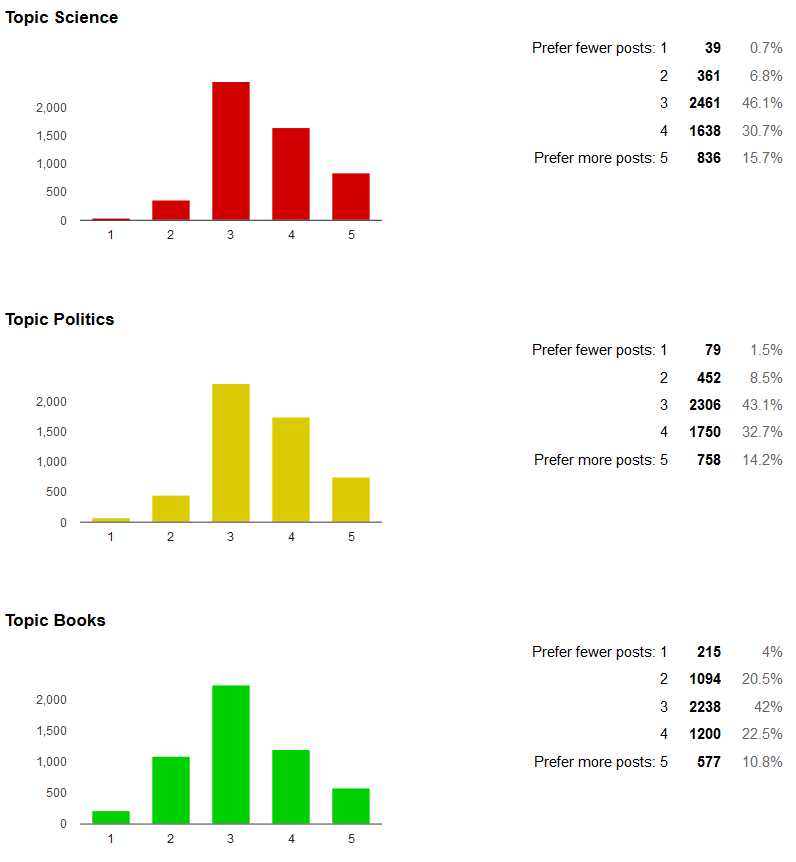
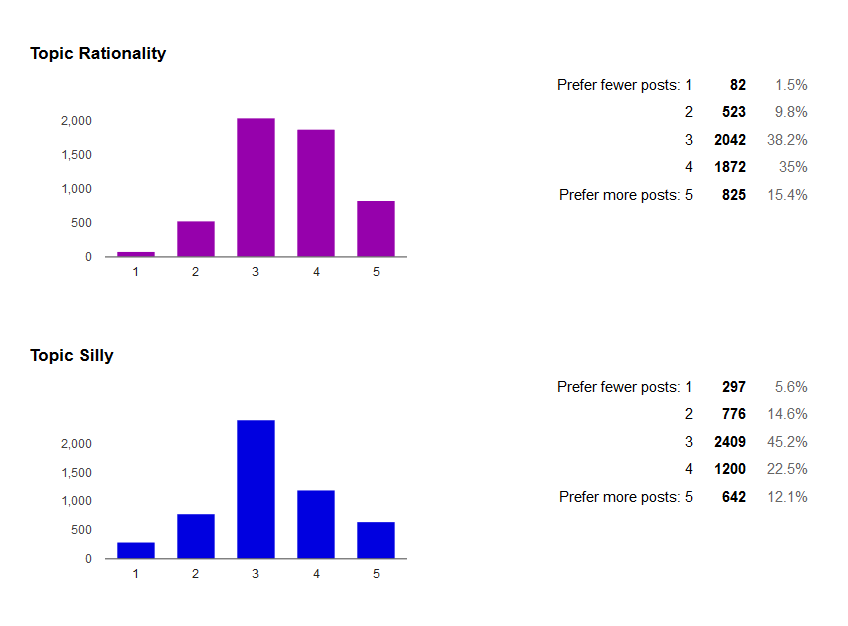
“Do you want SSC to focus more or less on the following topics?”
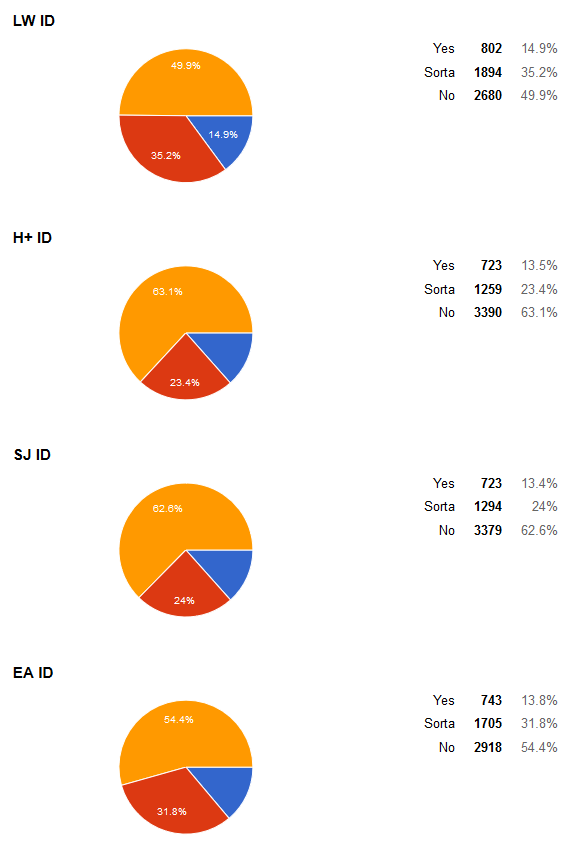
“Do you identify as a member of the following communities?”
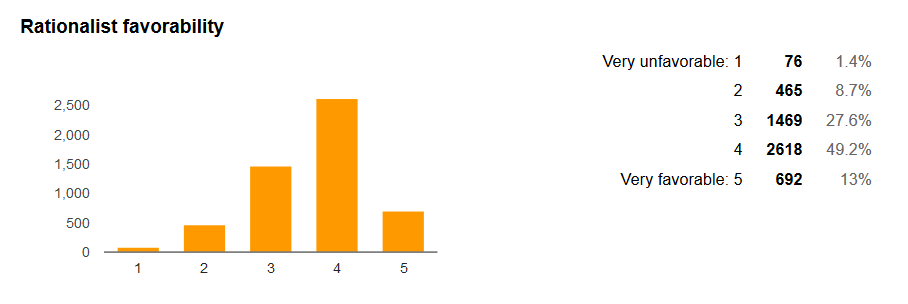
“What is your opinion of the rationalist commmunity?”
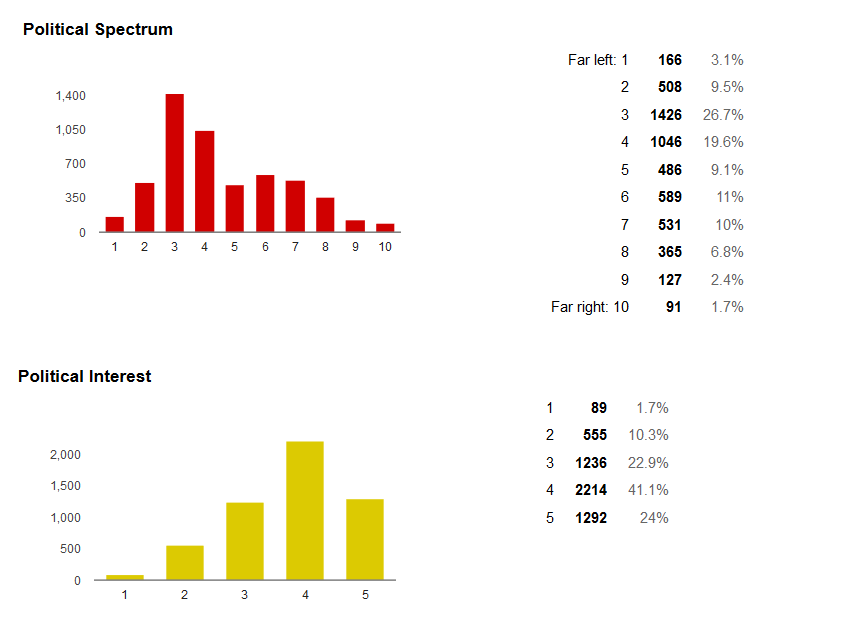
“Where do you fall on a classic political spectrum?”
“How interested are you in politics?”
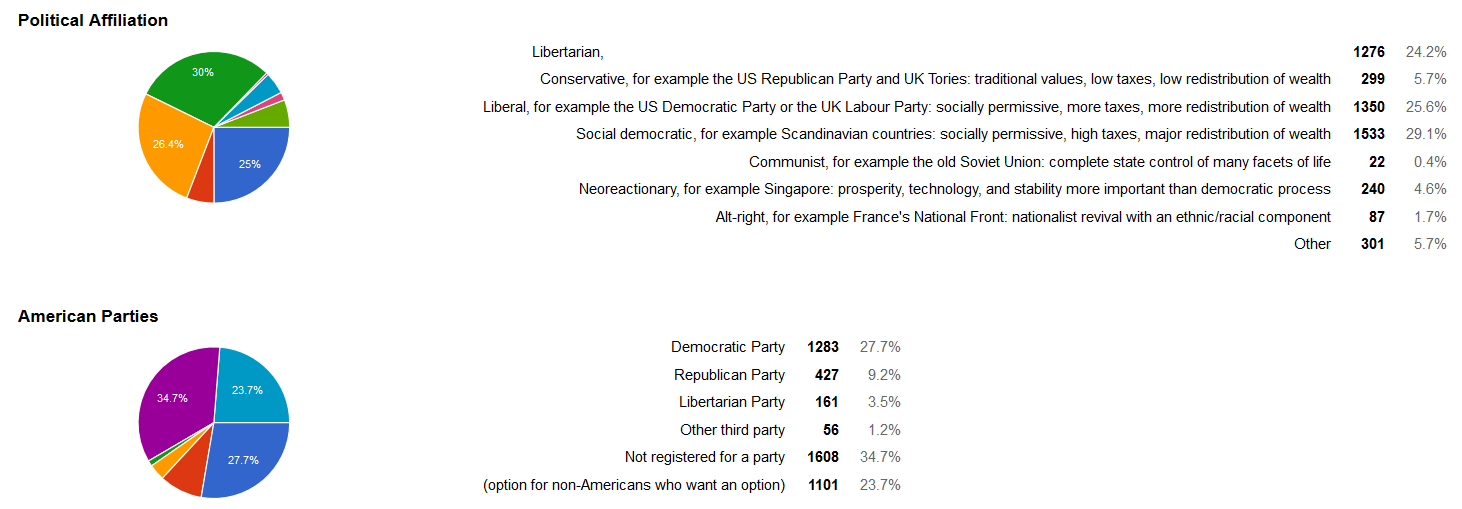
“Which of these political philosophies do you most identify with?”
“If you are an American, what party are you registered with?”
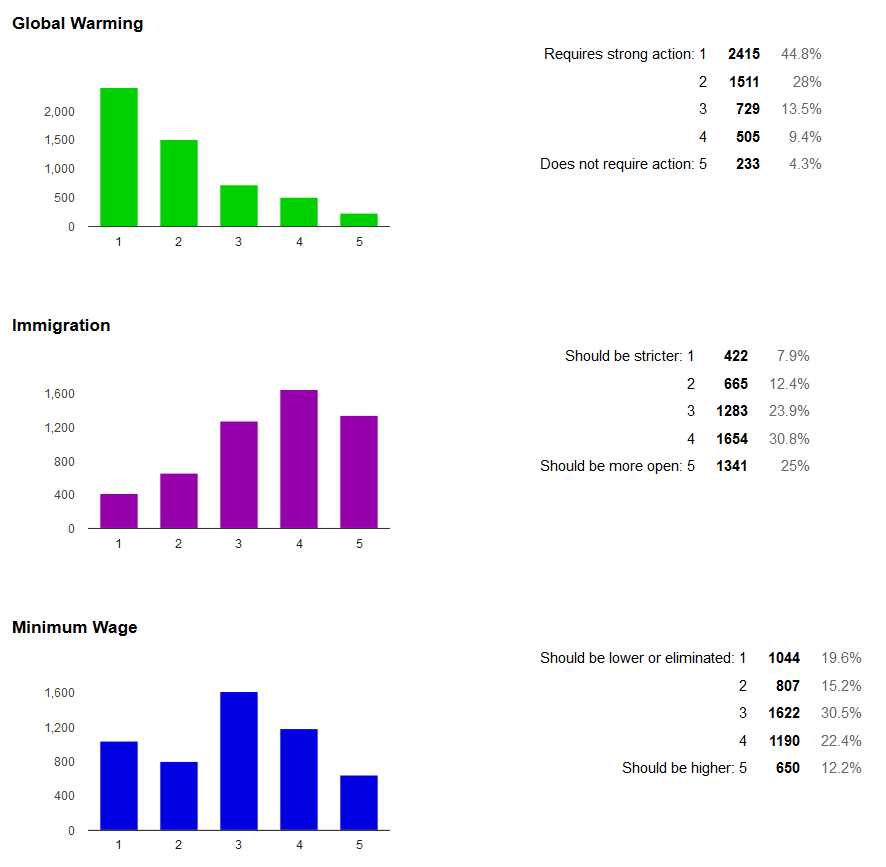
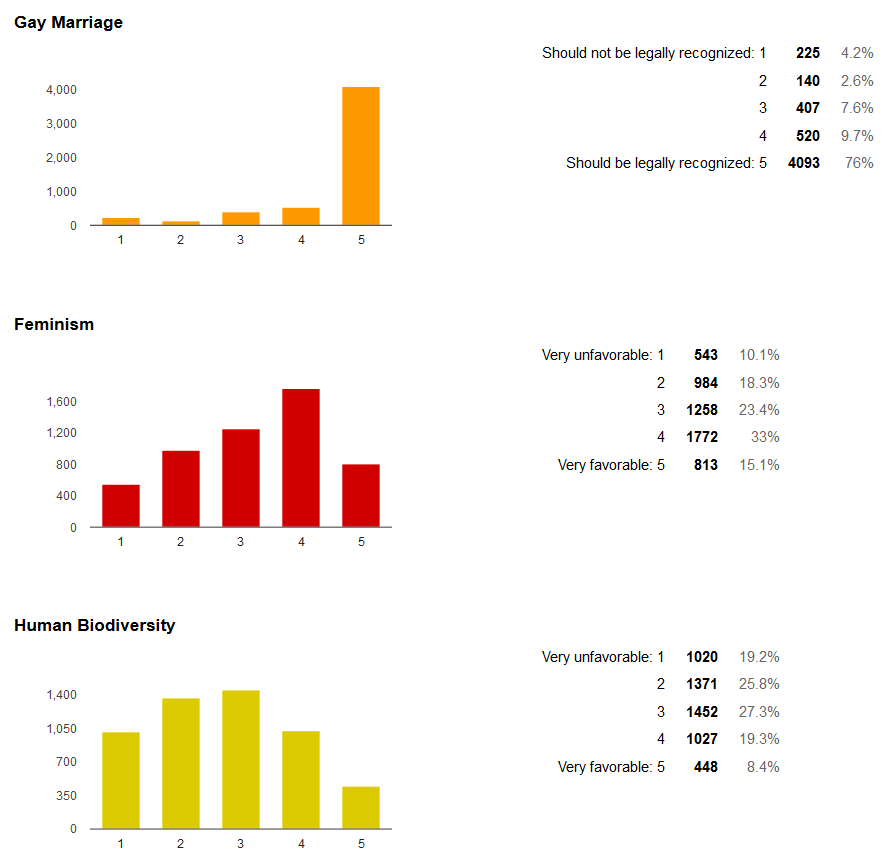
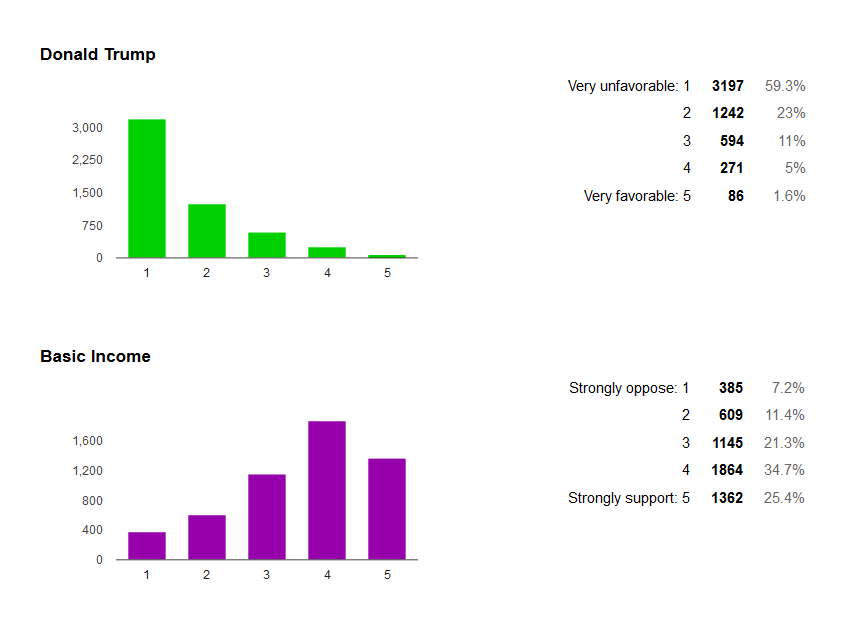
“What is your position on the following issues?”
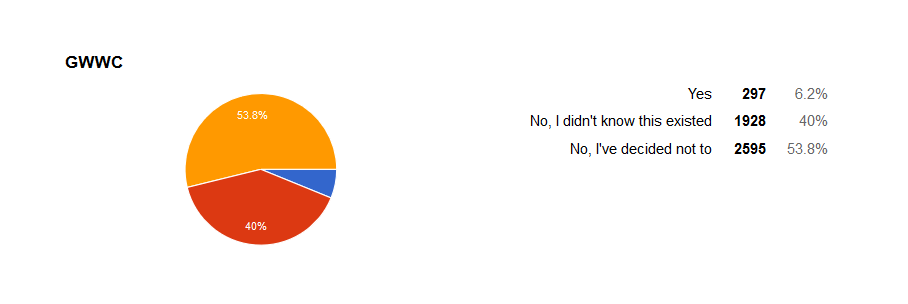
“Have you taken the Giving What We Can pledge?”
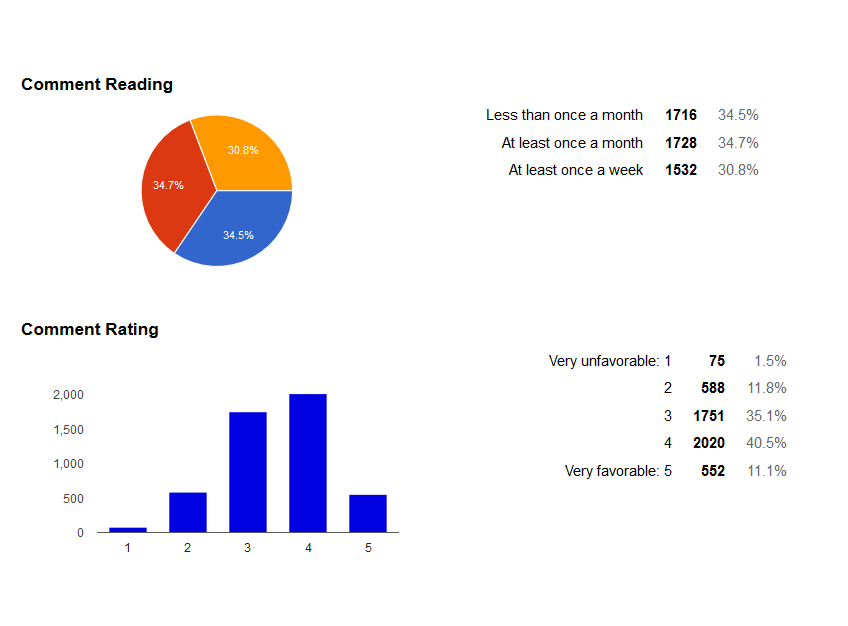
“How often do you read the SSC comments?”
“What is your opinion of the SSC comment section?”
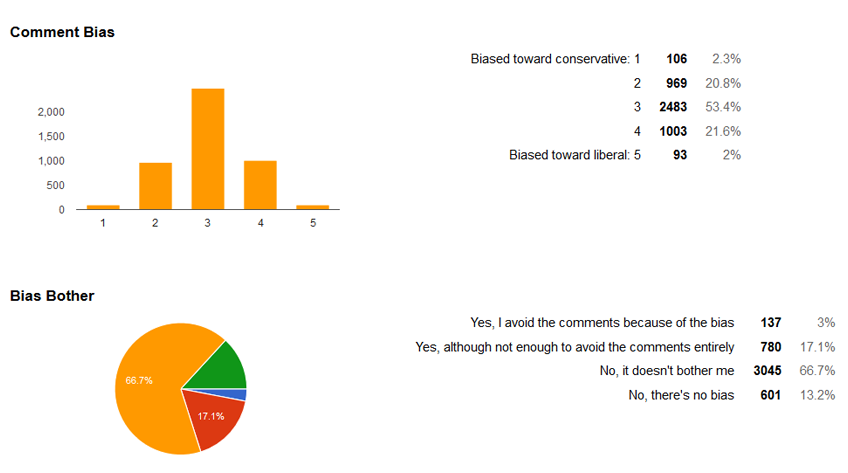
“Do you find an ideological bias among SSC commenters?”
“Are you bothered by a bias in SSC comments?”
“What is your opinion on the level of comment moderation?”
“What is your opinion on the level of identity politics discussion in the comments?”
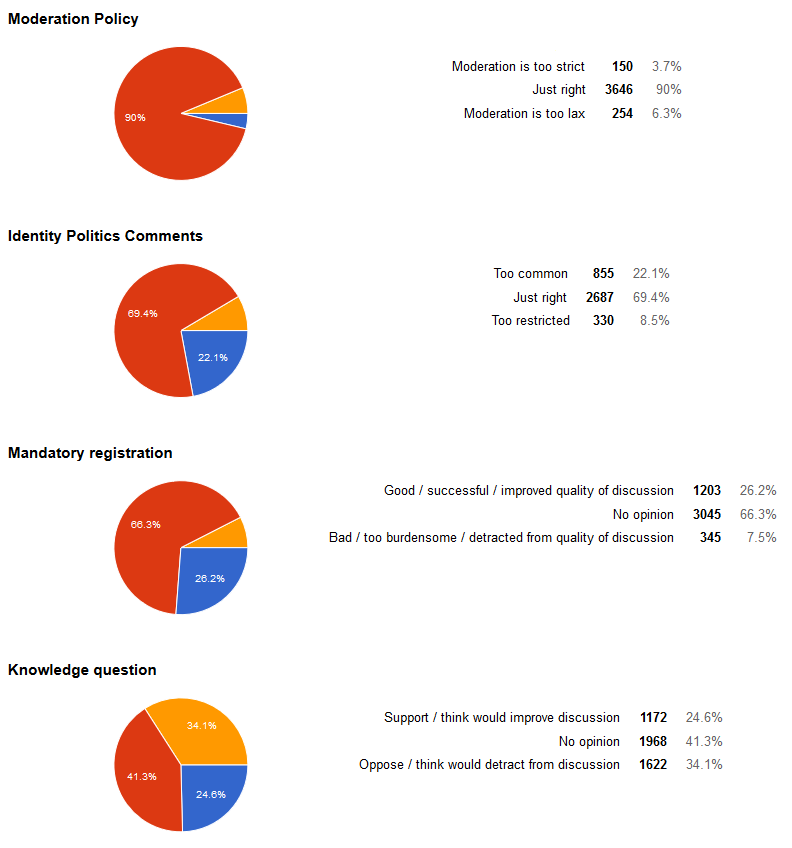
“What is your opinion on the recent policy of requiring all commenters to register accounts?”
“What would you think of requiring new commenters to answer a knowledge question before being allowed to register?”
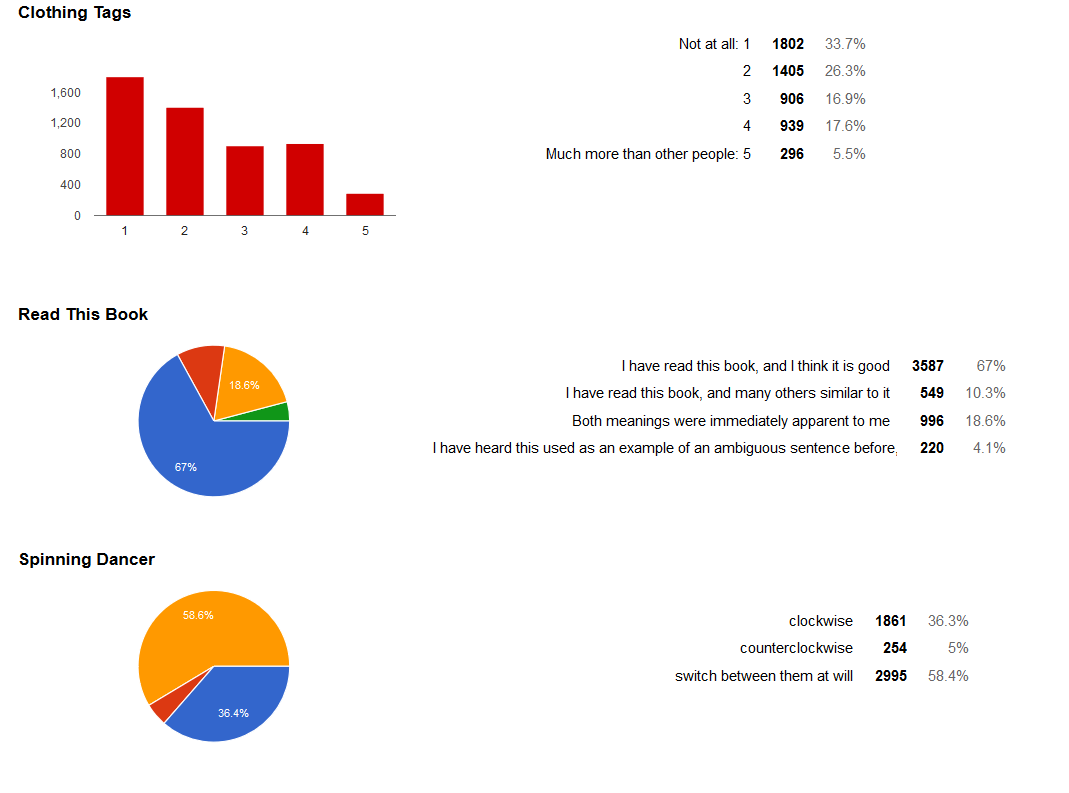
“Are you bothered by scratchy tags on your clothing?”
“How do you interpret the sentence ‘I have read this book and much like it’?”
“What direction do you see in the spinning dancer illusion?”
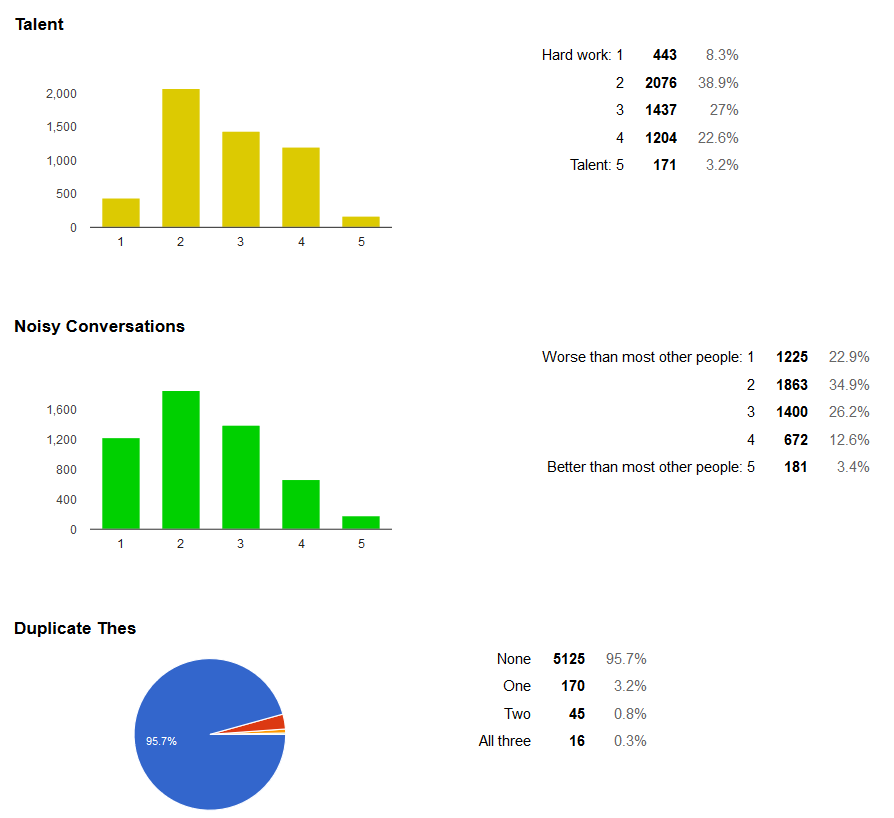
“Which do you think is more important when trying to learn a new skill: hard work or talent?”
“Do you find it hard to follow conversations in noisy areas?”
“How many of the three duplications of the word ‘the’ (ie ‘the the’) did you notice in this survey?”
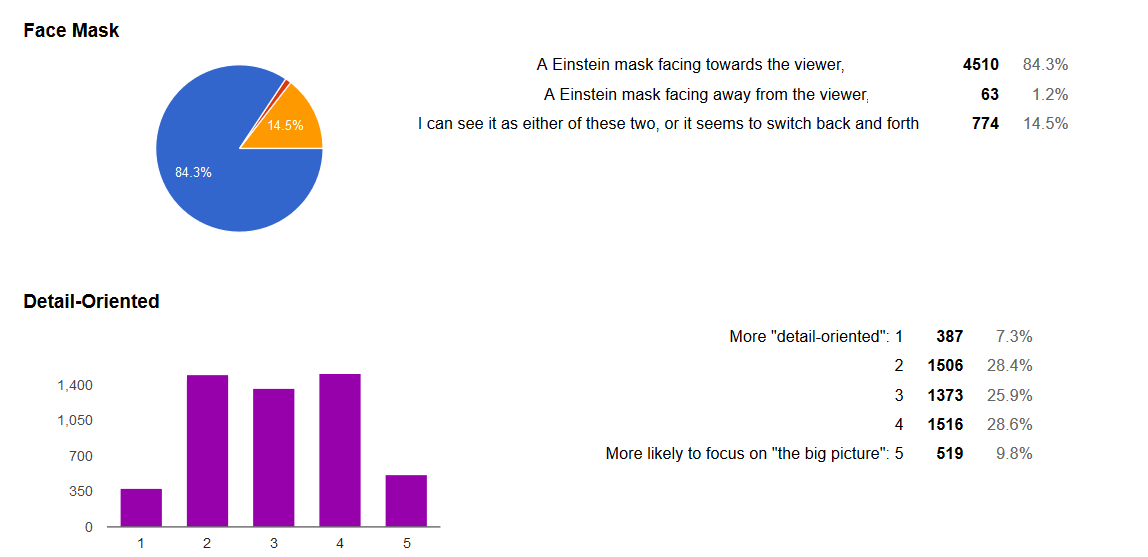
“How do you interpret the Einstein mask illusion?
“Do you think of yourself as more detail-oriented or more big-picture?”
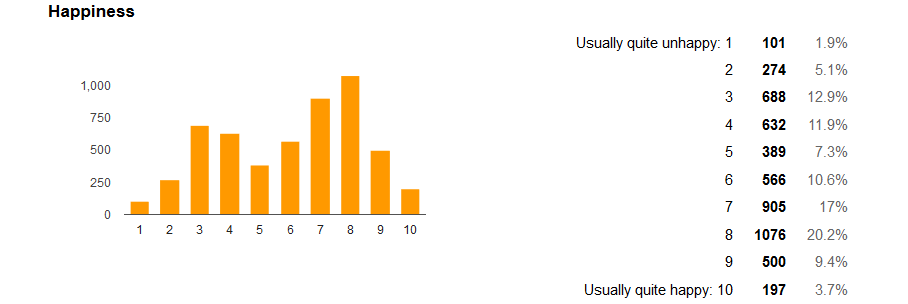
“How happy do you generally feel?”
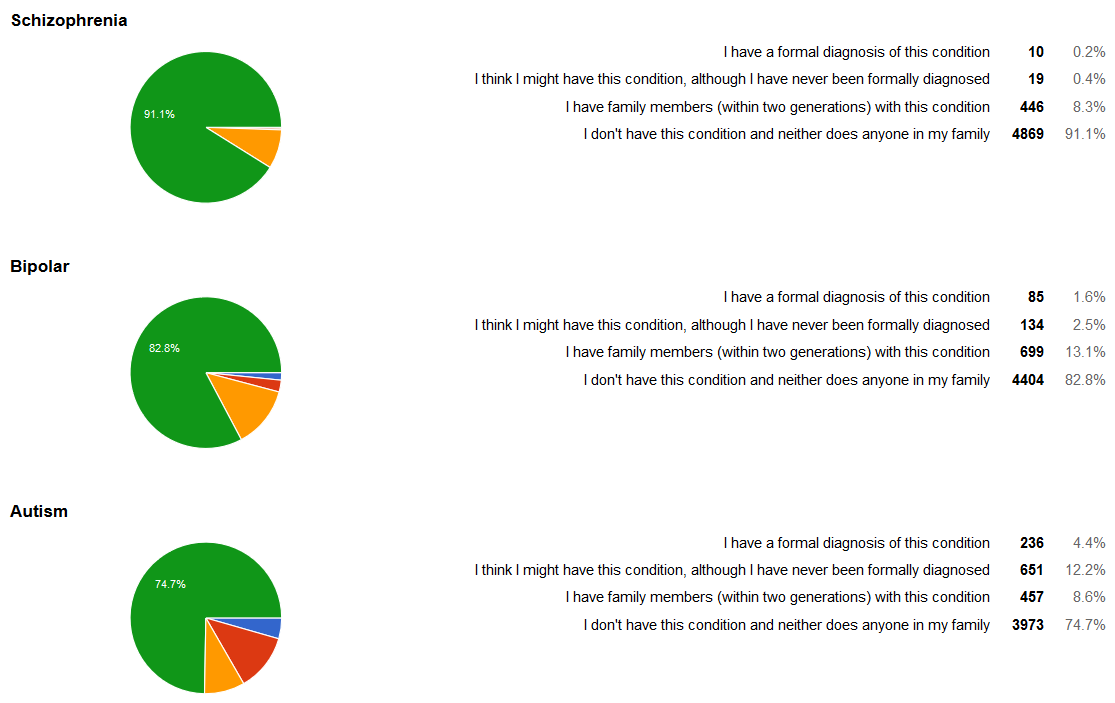
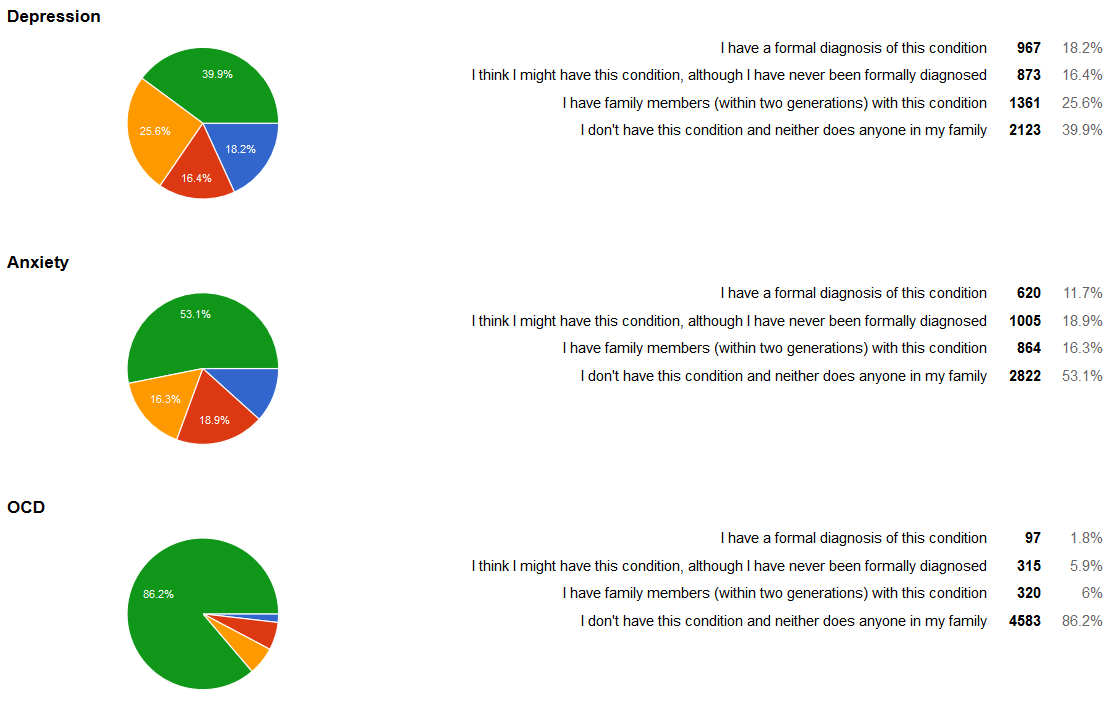
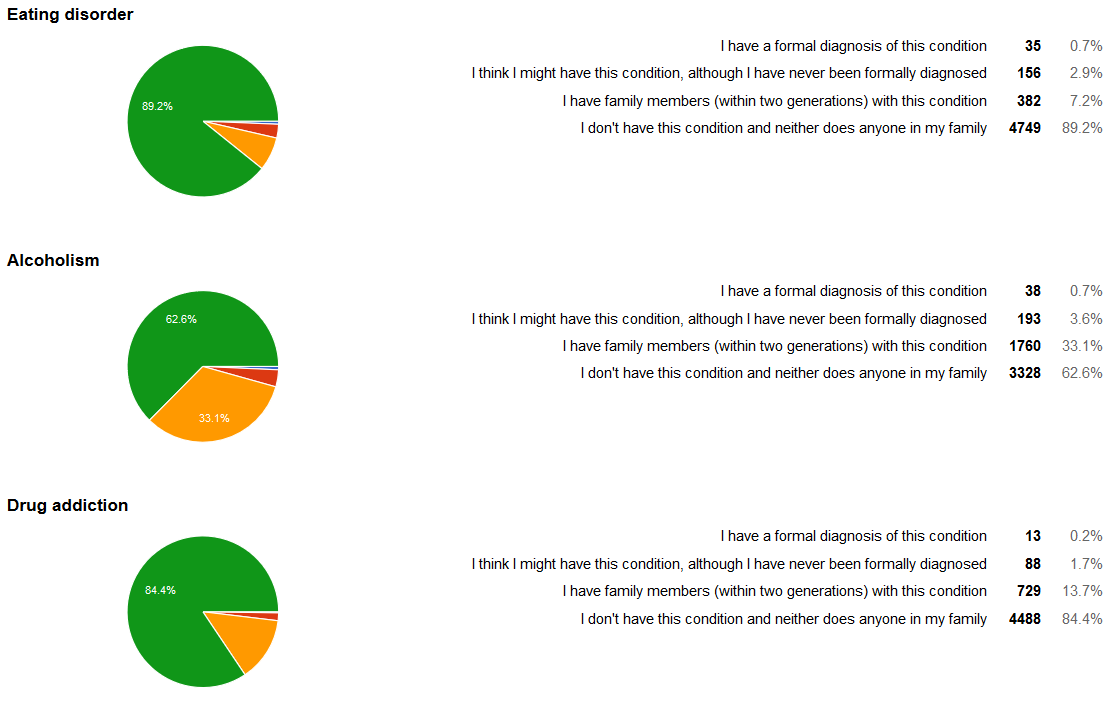
“Do you have any of the following psychiatric diagnoses?”
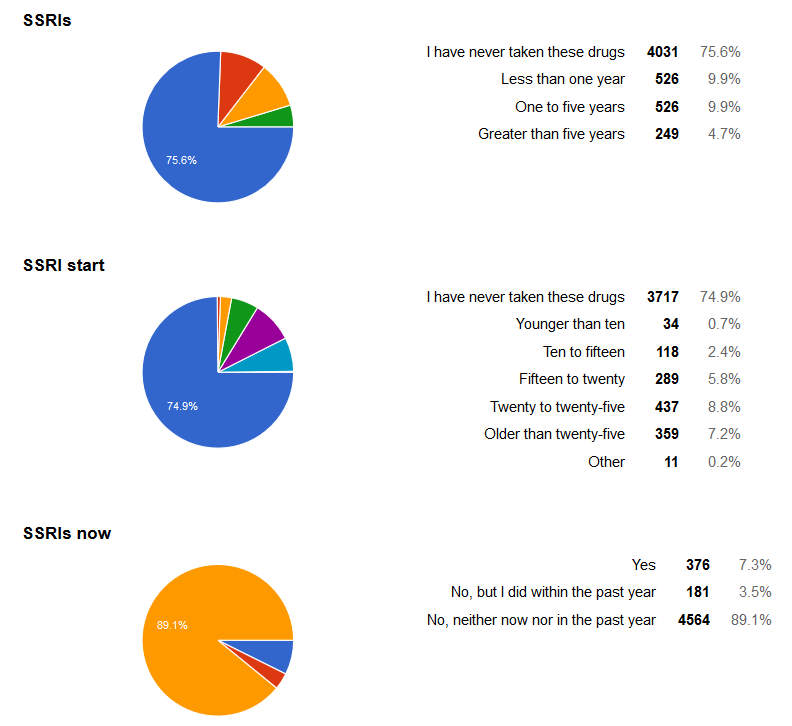
“Have you been on SSRIs?”
“At what age did you start SSRIs?”
“Do you currently use SSRIs?”
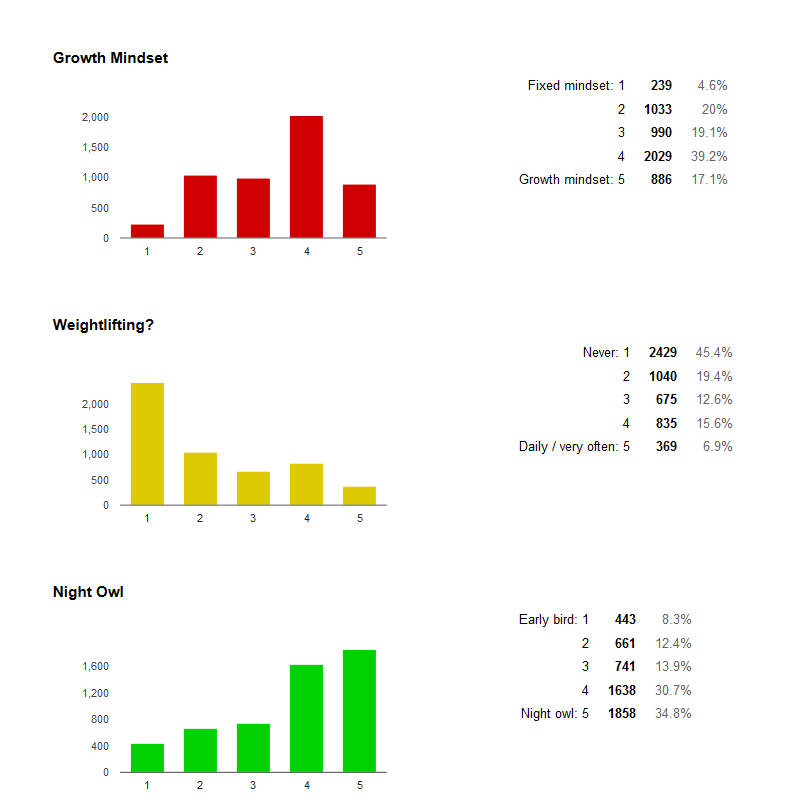
“Do you think of yourself as more ‘growth mindset’ or ‘fixed mindset’?”
“Do you lift weights?”
“Regarding sleep, are you an ‘early bird’ or a ‘night owl’?”
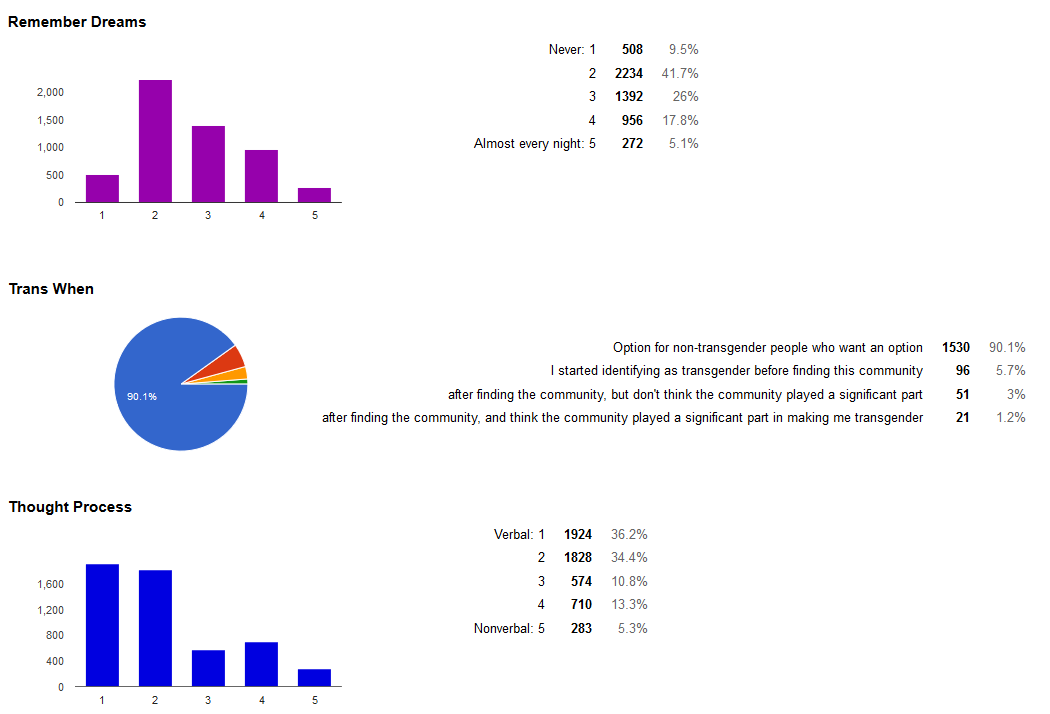
“How often do you remember your dreams?”
“If you are transgender, when did you realize this?”
“Does your internal thought process feel verbal or nonverbal?”
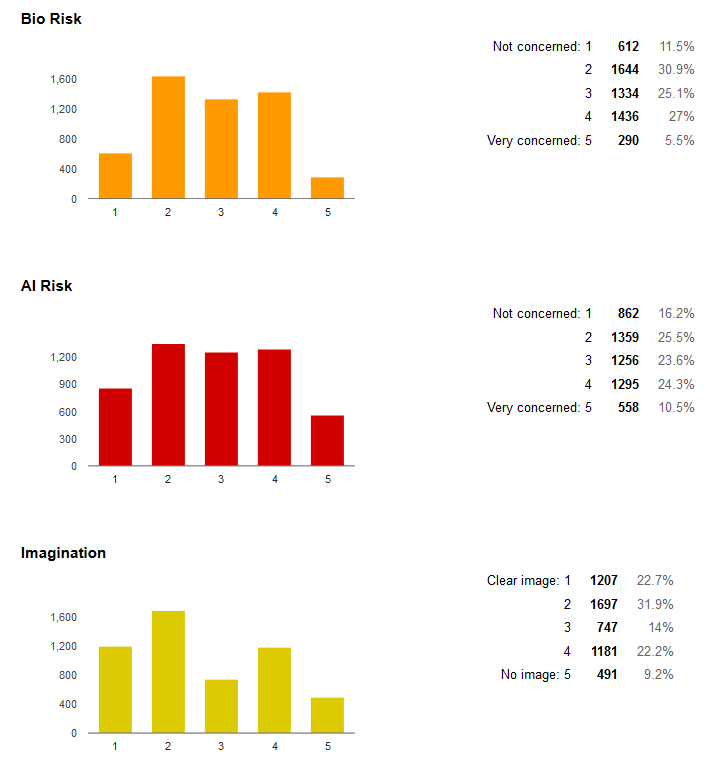
“How concerned are you about bioterrorism as a threat to humanity?”
“How concerned are you about superintelligent AI as a threat to humanity?”
“Are you able to clearly visualize images in your mind through imagination?”
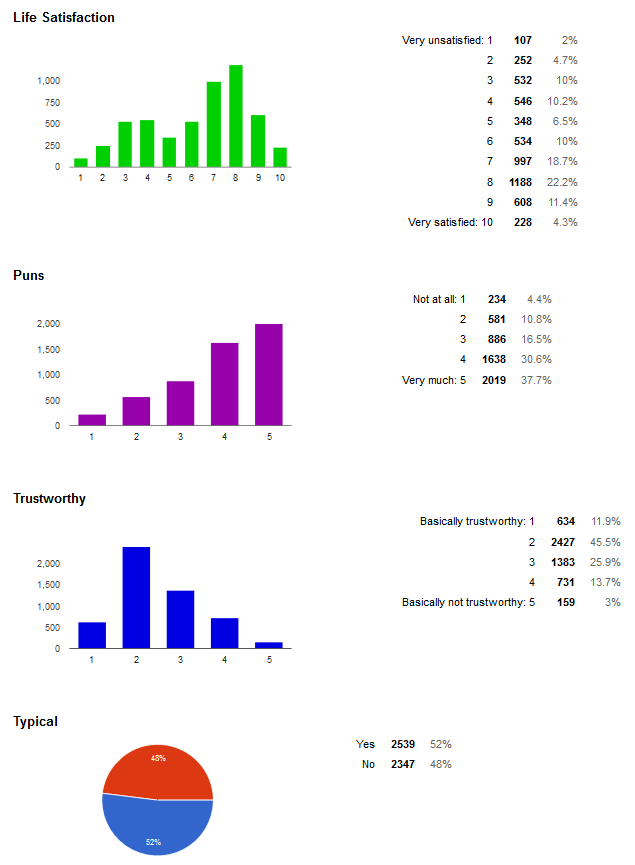
“Overall, how satisfied are you with life?”
“How much do you enjoy puns?”
“Do you think other people are basically trustworthy?”
“Do you think you are ‘a typical SSC reader’?”
II.
Some means:
Age: 30.6
IQ: 138.5
SAT out of 1600: 1471.9
SAT out of 2400: 2218.68
(Congratulations to the person who got a 1650 on their SAT/1600, and the person who got a 2450 on their SAT/2400. You clearly have bright futures ahead of you.)
Income (mean): $96,443.5
Income (median): $57,000
The highest observed incomes were in the $10,000,000 range; I know some big venture capitalists read this so I didn’t delete them as obvious trolls. Removing everyone who makes over $1 million, mean income goes down to $79,000. But there were also people who put down incomes of 0 because they were students, unemployed, or homemakers. When these people are also taken out, the mean of the remaining 2,700 people goes back to $98,000, and the median to $75,000.
Below are some Likert scales. Note that the midpoint is not what you think. On a 1-10 scale, the midpoint is 5.5, not 5. On a 1-5 scale, the midpoint is 3, not 2.5.
Political spectrum: 4.55 / 10 (higher = further right)
Political interest: 3.75 (out of 5)
Global Warming: 2.0 / 5 (higher = more skeptical)
Immigration: 3.5 / 5 (higher = fewer restrictions)
Minimum Wage: 2.9 / 5 (higher = higher minimum wage)
Gay Marriage: 4.5 / 5 (higher = should be legally recognized)
Feminism: 3.3 / 5 (higher = more favorable)
Human Biodiversity: 2.7 / 5 (higher = more favorable)
Donald Trump: 1.7 / 5 (higher = more favorable)
SSC Science Articles: 3.5 / 5 (higher = want increased focus)
SSC Politics Articles: 3.5 / 5 (higher = want increased focus)
SSC Book Reviews: 3.2 / 5 (higher = want increased focus)
SSC Rationality Articles: 3.5 / 5 (higher = want increased focus)
SSC Silly Articles: 3.2 /5 (higher = want increased focus)
Happiness: 6.0 / 10 (higher = happier)
Life satisfaction: 6.3/10 (higher = more satisfied)
Charity: $3271.6 / year
Percent given to charity: 2.8%
Among people who were employed (not students, unemployed, or homemakers), the numbers were surprisingly similar. Median charitable donations were a very disappointing $300/person, and median percent charity was 0.7%. But 358 people (out of 3500 for whom I had good data) gave 10% or more to charity, and 25 people gave 25% or more to charity. 13 people gave more than $100,000 to charity per year.
III.
Some more complicated things I was looking for. Everything in italics was “pre-registered”, ie guessed before looking at data and describing a future data analysis plan. I use { and } in place of the normal less-than and greater-than signs because I can’t be bothered to figure out how to not make them confuse the HTML.
Hypothesis 1: There will be a general ‘ability to tolerate ambiguity’ which links being able to see the spinning dancer go either direction, being able to see the face mask either direction, and being simultaneously aware of both meanings of the sentence about reading books. In other words, all three of these areas will correlate with each other. They might also correlate with liking puns.
Results: I ran correlations between SpinningDancer, FaceMask, ReadThisBook, and Puns. Since there were four variables, it came out to six (n * n-1 / 2) different correlations. Of these, three were positive and significant:
FaceMask x Puns: r = 0.03, p = 0.03
FaceMask x ReadThisBook: r = 0.08, p { 0.001
Puns x SpinningDancer: r = 0.05, p { 0.001
And three weren’t:
FaceMask x SpinningDancer: r = 0.01, p = 0.55
Puns x ReadThisBook: r = 0.01, p = 0.56
ReadThisBook x SpinningDancer: r = 0.02, p = 0.10
I don’t see any patterns in which ones worked or didn’t; in particular, I would have expected ReadThisBook to correlate with liking puns, since it was the same kind of verbal/linguistic ambiguity. The significance here was so good that I’m reluctant to just throw out this whole idea, but the effect size was pretty small and I’m honestly not sure what to do with this.
Hypothesis 2: There will be a general ‘tendency towards bottom-up processing’ which links being detail-oriented, noticing the duplicated “thes”, getting annoyed with tags on clothing, and not being able to tolerate noisy conversations. In other words, all four of these areas will correlate with each other.
Results: Again, the four variables made six different correlations. All six were positive and significant.
ClothingTags x NoisyConversation: r = -0.1, p { 0.001
ClothingTags x DuplicateThes: r = 0.08, p { 0.001
ClothingTags x DetailOriented: r = -0.03, p = 0.02
NoisyConversations x DuplicateThes: r = 0.05, p = 0.001
NoisyConversations x DetailOriented: r = 0.1, p { 0.001
DuplicateThes x DetailOriented: -0.03, p = 0.02
Once again there are some very impressive p-values but all the correlations are very weak. At this point I started wondering whether maybe my methodology was broken. I tried correlating these against a panel of a dozen political topics that I wouldn’t expect them to correlate with. ClothingTags correlated with two political topics, usually at around p = 0.01. NoisyConversation correlated with six political topics, again at similar levels, and so on for the rest. I can sort of make up stories about why this might happen (people who didn’t like noisy conversations didn’t like Donald Trump, and he is a loud kind of guy) but I’m not going to go that direction. The results weren’t just a general factor of people who like putting large numbers into surveys, because the correlations were just as frequently negative as positive. So I’m not sure.
Overall the correlations between real interesting psychological factors that seemed like they should be correlated were larger and more frequent than the correlations with unrelated political topics, but they were all so small, and everything is so noisy, that I’m not going to count this as a meaningful victory. The only ones that approached being interesting were the correlations between clothing tags, noisy conversations, and detailed-orientedness, which everyone already knows are all kind of autistic-y traits.
Hypothesis 3: People who used SSRIs during childhood (or maybe during puberty? or both?) are more likely to be asexual. In other words, asexuality rates for these groups will be higher than those of people who used SSRIs during adulthood and people who never used SSRIs. If sample size permits, I will try to exclude current users of SSRIs from all groups to rule out them being “asexual” because current SSRI use is ruining their libido.
Results:
(by age at which they started SSRIs, and asexuality rate)
UNADJUSTED
Younger than 10: 7%
10 – 15: 9%
15 – 20: 9%
20 – 25: 7%
Older than 25: 4%
Never on SSRIs: 6%
Okay, I didn’t realize how many different categories I had, so my fancy preregistration is going to have to go. I am going to, in an ignoble unpreregistered way, combine everyone who started an SSRI at 20 or younger, with everyone who started it older than 20 or not at all. An independent samples t-test comparing mean asexuality between those two groups finds…not much.
More specifically: there were 4490 people who hadn’t taken SSRIs while young, and 435 people who had. The respective asexuality rates in the two groups were 6% and 9%. The difference was about p = 0.1. Adjusting out people currently on SSRIs did nothing whatsoever.
I conclude that my hypothesis was wrong, and taking SSRIs during puberty is not a risk factor for asexuality. Note that taking SSRIs not during puberty isn’t a risk factor for this either, and there was minimal difference in asexuality rate between people who had ever taken SSRIs and those who had not. Either permanent loss of sexuality from SSRIs is so vanishingly rare that a survey of 5500 people cannot pick up on it, or it is impossible to confuse with “asexuality” as an orientation and I should have asked the question some other way.
IV.
Okay, so much for fancy responsible hypothesis preregistration. Everything following is whatever interesting came out of a giant fishing expedition. Because of the previously noted tendency for things to be super-highly-significant in this dataset even when they’re sketchy, I’m including only things with a decent effect size (r } 0.1). Everything in this category automatically has p { 0.001. I’m not including results I think are obvious.
The more trustworthy you think other people are, the higher your life satisfaction (r = 0.19)
The more visual your imagination, the more likely you are to remember dreams: (r = 0.16)
The more trustworthy you think other people are, the less likely you are to like Donald Trump (r = 0.14)
The more trustworthy you think other people are, the more likely you are to support more open immigration (r = 0.19)
The more you describe yourself as having a growth mindset, the higher your life satisfaction (r = 0.18). Bizarrely, describing yourself as thinking hard work matters more than talent doesn’t predict life satisfaction at all. It’s just the words “growth mindset”
If you don’t like noise or noisy conversations, you are less likely to be a generally happy person (r = -0.13, -0.17)
Night owls are less happy than early birds (r = -0.13)
Weightlifting was positively linked to life satisfaction (r = 0.1), negatively to asexuality (r = 0.1) and to various right-wing beliefs at around r = 0.1. It was negatively linked to being a night-owl (r = -0.1)
The more liberal you were, the more likely you were to think SSC comments had a conservative bias, and vice versa.
V.
You might have noticed some very positive feelings about the comment section. The average person rated the comments 3.5/5 (median: 4/5). On a scale from 1 to 5, where 1 was “biased conservative” and 5 was “biased liberal”, the average score (both mean and median) was 3, ie exactly in the middle. From a wisdom of crowds perspective, you rate the SSC comment section as literally the least biased it is logically possible to be.
79.9% of commenters said they were “not bothered” by any bias in the comment section. The 20.1% of people who were bothered by comment section bias (n = 908) were very slightly more liberal than SSC as a whole (4.05/10 compared to 4.55/10, where higher is more conservative). This group rated the comment section as having a very slight conservative bias (2.6/5, where lower is more conservative) but there was a high standard deviation. In other words, this group contained both people annoyed that the comments were too conservative, and people annoyed that the comments were too liberal, with a very slight preponderance of the former.
So this is people’s perception. Can we measure reality? We know that SSC as a whole is very slightly liberal, but what about frequent commenters? Here are the numbers, again on a political spectrum where 1 is maximally liberal and 10 maximally conservative:
1. Lurkers who never comment: 4.5
2. People who comment less than once a month: 4.7
3. People who comment at least once a month: 5.1
4. People who comment at least once a week: 5.2
5. People who comment many times a week: 6.3
So there is a really interesting tendency for conservatives to comment more often than liberals (maybe because they have more to disagree with?). But numbers in the last three groups were very small: out of the 5335 people for whom I had data, only 54 commented once a week, and only 45 commented many times a week. So they may not be able to bring the average up very much. Since tiers 1 through 4 were liberal (REMEMBER THE MIDPOINT IS 5.5) and only tier 5 was conservative, there’s probably an extremely slight preponderance of liberal comments on the whole.
I checked opinions of the 1100 people who comment once a month or more, and they were broadly similar to those of the general population.
I had a question in which I asked people to guess what percent of survey-takers would be right-wing (ie greater than 5.5 on the political spectrum question). The true answer is that of 5335 respondents, 1703 (31.9%) were 6 or above. 485 (9.1%) were at exactly 5 (technically to the left of center but not obviously so from the scale). 3,144 (58.9%) were unambiguously left of center.
So the correct answer to the estimation question was 31.9%. The average person guessed 34.9% (mean) or 35% (median), so you were pretty on-the-mark.
(In case you’re wondering, I was expecting to find that most people were lefties but thought everyone else was on the right. The first part was true, the second part not so much).
There was a very slight effect where, the longer someone has been reading the blog, the more conservative they are likely to be. Someone reading SSC more than two years is 4.7 on the scale; someone less than a year, about 4.3. My guess is that I got a few extra conservatives back when I wrote about the far right more.
VII.
Just for fun, I wanted to see how this community differed from the rest of the population, so I got a hundred Mechanical Turkers from the US and UK to fill out a slightly-edited version of the same survey. The sample size isn’t big enough to say anything for sure, and I’m not going to bother figuring out how to do t-tests across two different datasets, but here are some things I noticed.
MTurkers were 72% white, 6% black, 6% Hispanic, 10% Asian, and 3% other. They were 68% male and 32% female. They were much closer to representative than SSCers.
2% were transgender, 11% bisexual, 5% gay, and 8% asexual, about the same percent as SSC readers. This surprised me. We may be unusually LBGTQetc for the US population, but not necessarily for the Internet population.
Their average IQ was 111, compared to our 138. Their average SAT score out of 1600 was 1272, compared to our 1472.
Turks were more likely to have schizophrenia than SSCers, though no more likely to have family members. Of note, 1% of Turks (1 person) had a formal schizophrenia diagnosis, and 7% (6 people) thought they might have schizophrenia. An 8% schizophrenia rate in a population is unheard of. I don’t know if MTurkers are disproprotionately likely to have schizophrenia, or if I just got a weird sample.
1% of Turks were formally bipolar and another 6% suspected bipolar. Compare to a more normal 2% and 2% among SSCers. About half of the Turks with suspected bipolar were the same ones with suspected schizophrenia.
0% Turks were formally autistic and another 4% were suspected autistic, compared to 4% and 12% of SSCers. We are apparently like 5x as autistic as normal. Who ever would have guessed?
10% of Turks were formally depressed and another 20% suspected, compared to 18% and 16% for SSCers. Kind of ambiguous between us being more depressed vs. better at getting diagnosed.
17% of Turks were formally anxious and another 17% suspected, compared to 12% and 16% of SSCers. There is a group we are less anxious than!
4% of Turks were formally OCD and another 7% suspected, compared to 2% and 6% of SSCers.
2% of Turks were formally eating disordered and another 3% suspected, compared to 1% and 3% of SSCers.
7% of Turks were formally alcoholic, and 3% suspected, compared to 1% and 4% of SSCers. The Turk number, which seems very high, actually fits better with epidemiological estimates of prevalence (though I don’t know about formal diagnosis). We are fantastically non-alcoholic. Oddly, this does not seem genetic – we have the same number of alcoholic family members as the Turks do.
5% of Turks are formally drug addicted and 2% suspected, compared to 0.2% (!) and 2% of SSCers. This one might be genetic: 25% of Turks have addicts in their families compared to 14% of SSCers.
28% of Turks are atheist+nonspiritual, 11% atheist+spiritual, 25% agnostic, and only 30% theist (committed or lukewarm). These numbers are way more atheist than the general population, but way less atheist than SSC.
Turks were 4.5 on the political spectrum, indistinguishable from SSCers. On specific issues, they were a little more restrictionist on immigration, a little more pro-Trump, a little more feminist, and a little less pro-gay. The only place there was a large difference ( } 1 point) was on the minimum wage, which they almost universally supported.
Contra my predictions, SSCers were actually less annoyed by clothing tags than Turkers (2.4 vs. 2.9) and no more annoyed by noise (3.0 vs. 3.0). We were about equally detail-oriented, and worse at following noisy conversations (2.4 vs. 3.1). We were a little more likely to believe in talent instead of growth mindset (2.4 vs. 2.7) and equally likely to be night owls.
We were less likely to remember dreams (2.7 vs. 3.0), less likely to have strong visual imaginations (2.4 vs. 2.6) and more likely to think verbally (2.2 vs. 2.6). We believed people were a little more trustworthy (2.5 vs. 2.9).
We were slightly less satisfied with our lives (6.3 vs. 6.4) and vastly less happy (6.0 vs. 6.9), even though we were earning an average of $97,000 and they were working on Mechanical Turk. This was probably the most striking result.
VIII.
I will be doing something with the meetup information shortly. Otherwise, this is all the data I have the energy to extract out of this right now. But there is a lot of stuff here. 5048 people kindly allowed me to share their data publicly, so I encourage anybody interested to play around with this and report what you find.