Beware Summary Statistics
Last night I asked Tumblr two questions that had been bothering me for a while and got some pretty good answers.
I.
First, consider the following paragraph from JRank:
Terrie Moffitt and colleagues studied 4,552 Danish men born at the end of World War II. They examined intelligence test scores collected by the Danish army (for screening potential draftees) and criminal records drawn from the Danish National Police Register. The men who committed two or more criminal offenses by age twenty had IQ scores on average a full standard deviation below nonoffenders, and IQ and criminal offenses were significantly and negatively correlated at r = -.19.
Repeat offenders are a 15 IQ points – an entire standard deviation – below the rest of the population. This matches common sense, which suggests that serial criminals are not the brightest members of society. It sounds from this like IQ is a very important predictor of crime.
But r = – 0.19 suggests that only about 3.6% of variance in crime is predicted by IQ. 3.6% is nothing. It sounds from this like IQ barely matters at all in predicting crime.
This isn’t a matter of conflicting studies: these are two ways of describing the same data. What gives?
The best answer I got was from pappubahry2, who posted the following made-up graph:
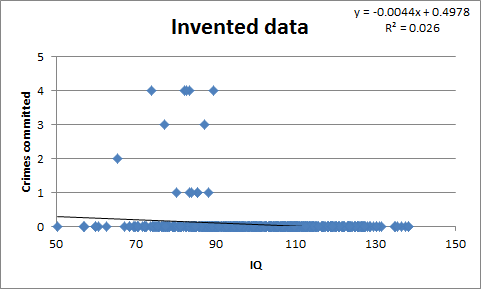 Here all crime is committed by low IQ individuals, but the correlation between IQ and crime is still very low, r = 0.16. The reason is simple: very few people, including very few low-IQ people, commit crimes. r is kind of a mishmash of p(low IQ|criminal) and p(criminal|low IQ), and the latter may be very low even when all criminals are from the lower end of the spectrum.
The advice some people on Tumblr gave was to beware summary statistics. “IQ only predicts 3.6% of variance in crime” makes it sound like IQ is nearly irrelevant to criminality, but in fact it’s perfectly consistant with IQ being a very strong predictive factor.
II.
So I pressed my luck with the following question:
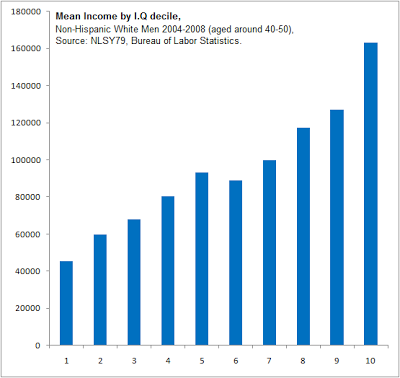
This graph suggests IQ is an important determinant of income. But most studies say the correlation between IQ and income is at most 0.4 or so, or 16% of the variance, suggesting it’s a very minor determinant of income. Most people are earning an income, so the too-few-criminals explanation from above doesn’t apply. Again, what gives?
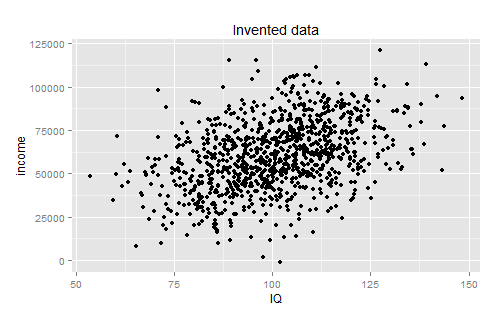
The best answer I got for this one was from su3su2u1, who pointed out that there was probably very high variance within the individual deciles. Pappubahry made some more graphs to demonstrate:
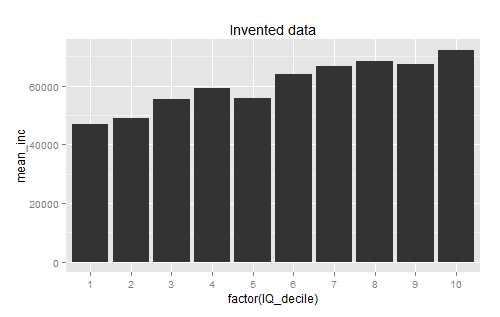
I understand this one intellectually, but I still haven’t gotten my head around it. Regardless of the amount of variance, going from a category where I can expect to make on average $40,000 to a category where I could expect to make on average $160,000 seems like a pretty big deal, and describing it as “only predicting 16% of the variation” seems patently unfair.
I guess the moral is the same as the moral in the first situation: beware summary statistics. Based on the way you explain things, you can use different summary statistics to make things look very important or not important at all. And as a bunch of people recommended to me: when in doubt, demand to see the scatter plot.