Highlights From The Comments On Survey Harassment Rates
[Content warning: harassment. This discusses the comments to SSC Survey Results: Sexual Harassment Levels By Field]
brmic writes:
Thank you for posting this and the data file. FWIW, I tried to reproduce the results and couldn’t reproduce the correlations between female victimization, male victimization and male perpetration. fem vic vs. male vic is 0.65, same as yours. fem vic vs. male perp is 0.01 for me, and male vic vs. male perp is 0.21 for me. Everything else more or less checks out.
As a reviewer, I’d say the combination score is not convincing, especially since it ignores all considerations of different male to female ratios in the various industries.
Also, if you have two measures with r = 0.8, Fig 6 is not a good idea IMHO. It’s probably just noise. (Also, it should be a dotplot centered around 1, because the relevant info is distance from 1:1 ratio.)
Instead, I’d focus on the correlation between female victimization at work and female victimization outside work of 0.65 (for me) and the same for males at 0.59, which also leads to the conclusion that there’s a strong ‘people in fields’ effect, without having to go through the combination score. If you’re so inclined, you might then do the at-work by outside-work ratios and end up a kind of cross-validation set, where you can see whether the bad fields for women are bad for men as well. Of course, once you then consider sex ratios per field. it’s story time all over again. Still, e.g. men report similar levels of out of work victimization in computers (20%) and Health Care (24%), but at work victimization of 4% and 12% respectively, which strongly suggests that Health Care is worse.
Their code is available here. Thanks for doing the work to try to replicate my results. I’ve removed the non-confirmed correlations from my post until I can figure out what’s going on with them. I agree that Figure 6 was barely worth it, which is why I tried to make Figure 4 (the unadjusted version) the center of my thesis.
Chris quotes a TIME article that argues that predominantly-male communities generally have lower harassment rates than predominantly-female communities:
Given the epidemic of campus rape, teenage girls and their parents are justifiably concerned about safety, just as teenage boys and their parents are worried about false accusations. What does any of that have to do with gender ratios? Well, there have been multiple studies showing a correlation between gender ratios and rates of sexual assault. As counterintuitive as it may sound, elevated rates of sexual assault are a predictable feature of communities with oversupplies of women, according to studies by sociologists Nigel Barber and Robert O’Brien.
The opposite is true of communities with oversupplies of men. Columbia University economics professor Lena Edlund investigated the impact of lopsided sex ratios in China, where young men now outnumber women by 20% due to sex selection, abortion, female infanticide, and other outgrowths of China’s old “One Child” policy. Edlund and her co-authors discovered that although overall crime rates went up in China as the gender ratio skewed more male—not surprising given that men are more prone to criminality—there was a precipitous decline in rape. It seems that men treat women better, and protect them more, when women are in shorter supply.
Can I prove beyond all doubt that Edlund’s and Barber’s findings also apply to college campuses—i.e. that rape is less common at schools that are at least half male? No, because the available data on campus rape tends to reveal as much about how forthright colleges are in handling sexual assaults—and how comfortable women feel reporting them—as it does about the actual frequency of assaults on a particular campus.
That said, I was intrigued by a recent Washington Post story on the topic. The article ranked 27 top colleges by their sexual assault rates, and I couldn’t help but notice which college had the lowest rate.
It was CalTech, a school that is 59% male.
But some commenters in the subreddit bring up contrary evidence. DinoInNameOnly links to a Pew poll finding that women in predominantly-male workplaces report more harassment. And Hepatitis Andronicus brings up Alaska, a heavily male-skewed state considered to be in “a sexual assault state of disaster”.
Rolaran argues:
I feel like a person who has had bad experiences in the tech industry is less likely to have continued reading a blog that argues (among other things) that problems in that field are overemphasized, and a person who has had nothing but good experiences in tech is more likely to have begun hanging around a blog where they felt like the author was sticking up for them. This is useful data for determining the experiences, preferences and demographics of SSC readers, but I would be considerably surprised if that could be generalized without some serious legwork.
I did consider this, but first of all, only the tiniest percent of my posts are on tech, and I think I might have only had one previous post that could by any stretch of the imagination have been considered about harassment in tech. Second, it’s not clear which direction this should skew things – some would argue that guilty people are more likely to push the “we have nothing to apologize for” line, and innocent people are more willing to critically self-examine their (or their tribe’s) problems. Third, I’m not sure this would really skew self-reported female victimization, self-reported male victimization, and self-reported male perpetration all in the same way.
Rachael writes:
I agree with most of your conclusions, but there’s still a major flaw in the survey methodology. It asked what industry people currently work in, and whether they’ve *ever* been harassed at work. Plenty of people have switched industries over the course of their career, and nearly everyone worked in retail or food service or similar as a teenager or young adult. So we have no idea how much of the reported harassment took place in industries other than the ones people currently work in, and probably skewed towards the industries that hire teenagers.
This is not only a good point, it’s a good point that would have been easy for me to fix if I had thought about it. Sorry.
Leah Velleman writes:
I wonder whether something gets lost here when we conflate the startup world (stereotypically an unsupervised bunch of pushy, risk-taking young single people) with — and I use this term lovingly — dinosaur tech companies (stereotypically a bunch of mild-mannered old married people, with a strong HR department looking over things).
The cultural gap between startups and dinosaur tech seems much bigger than, say, the gap between independent and chain restaurants, or small and large universities. If that’s true, then that’s an argument for treating startups and dinosaur tech as separate sectors. (And while some companies might be hard to sort into one category or the other, that’s true for any set of categories. “Is this job in econ or finance?” and “Is this job in business or law?” will turn up ambiguous cases too, but that’s not a reason to ditch those distinctions.)
I’m pushing this question because I have a hypothesis, which is that startups really do have a harassment problem — but that the people speaking up about it, and the news outlets quoting them, have misrepresented this as a problem across all of tech, ignoring the fact that most tech workers are at boring old companies with low harassment rates. I suspect this misrepresentation has happened partly because startup folks like to represent themselves as The Real Tech Industry, The One That Counts, and partly because companies tend to transition from “startup” to “dinosaur” over time and news outlets can’t be bothered to keep track.
Riceowlguy on the subreddit writes
I think it would be worthwhile to try and distinguish between “people whose job is actually writing code or keeping IT systems running smoothly” versus “people who have jobs at tech companies but whose work is not technical”. My recollection is that a lot of the anecdotal horror stories about harassment in Silicon Valley involve VCs, sales/marketing people, upper management, etc.
One question is whether people in that latter category (if any of them read SSC at all!) answered “computers” or “business” for their profession.
Doug writes:
Maybe men in these groups are just less sexually aggressive and more introverted. It’d be interesting to aggregate # of lifetime sexual partners by industry and correlate with levels of sexual harassment. Not that I’ve ever been involved in sexual harassment on either side of the table… But my guess is that most cases don’t look like Alice walking over to Bob’s desk and grabbing his crotch out of the blue. Most situations probably escalate from some fun, flirty, or social interaction that one party takes to far. Programmers don’t know how to flirt and avoid socializing, so they never get into these situations. Existing literature on sexual assault shows that it disproportionately occurs in environments of “revelry” and “carousing”. I don’t see any reason workplace harassment would deviate from this pattern. Pharma reps get drunk with their coworkers a hell of a lot more than mathematicians.
I’d been thinking of “introversion” as the default hypothesis, not requiring explanation in the same way as the others, but I realize I might have forgotten to mention it at all. Sorry.
But Terran has analyzed (original comment, small correction) whether these results are explained by the Big 5 personality traits of people in each field. He finds they generally are not – profession remains important even after looking at traits (including introversion). Stezinec on the subreddit tries the same thing – their analysis finds that, after adjusting for traits, the only significant result is that computer-related occupations have lower harassment – but guessing this is just a sample size issue and the computer industry was the only one with a good sample size.
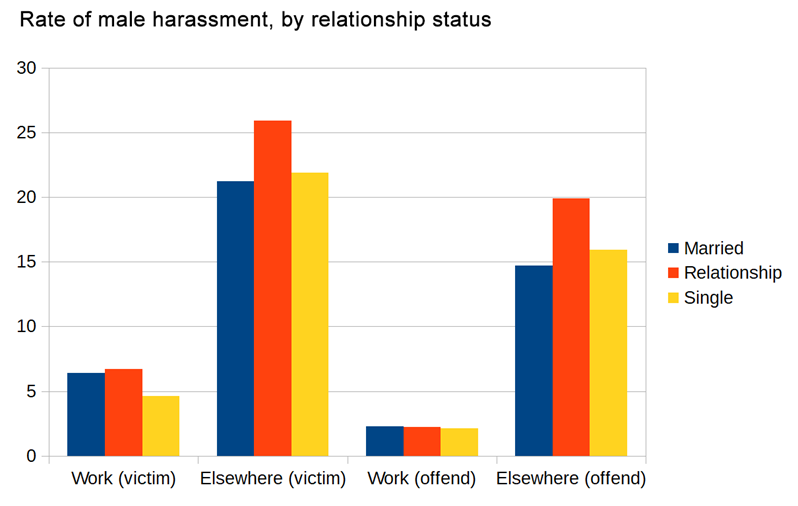
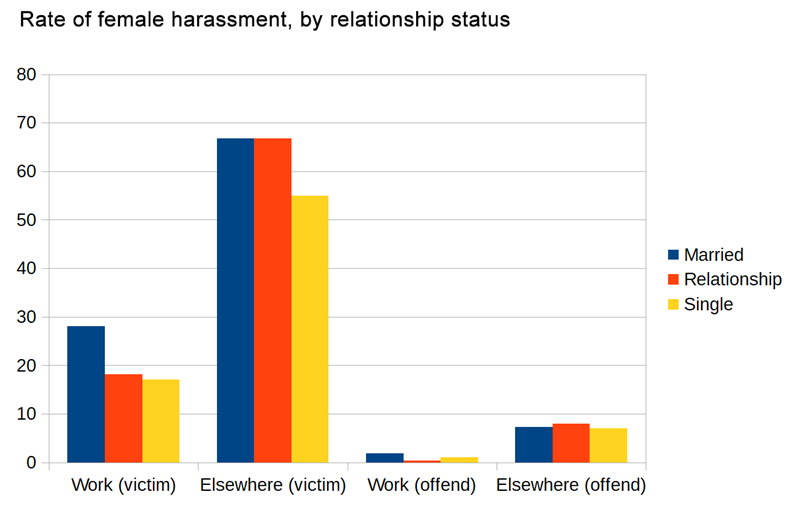
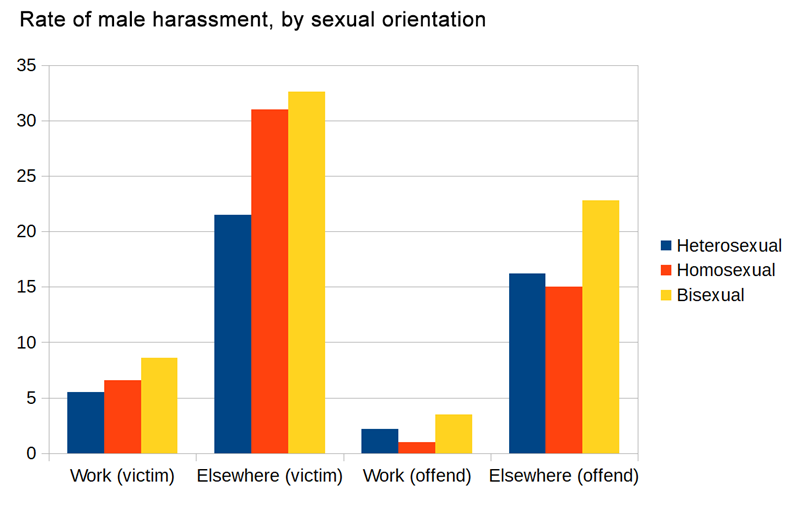
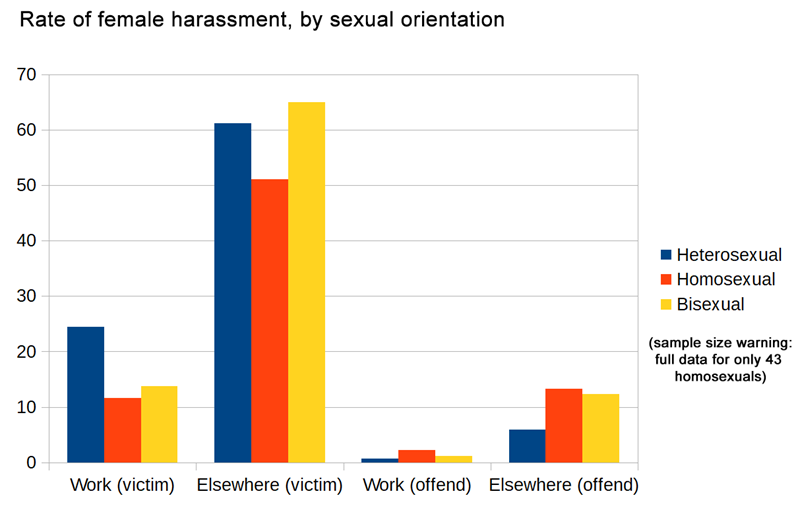
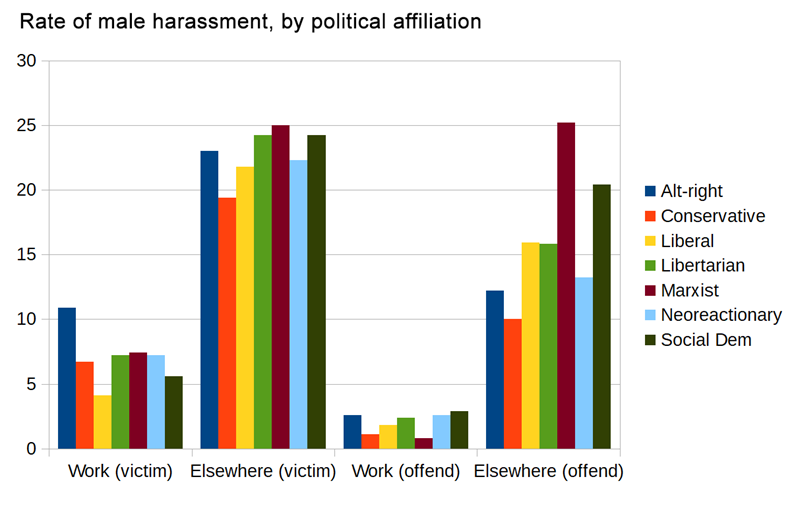
In case you are interested, here are some other factors that affected sexual harassment in the survey. I’m not putting error/significance bars on because that would be too much work – but if I have to have a nice-sounding explanation, it’s because I want to discourage people from using these to say “Your ingroup is more harassy than my ingroup, proving you’re bad”. The best one can do without error bars is disconfirm statements like that – which I think is generally a more prosocial activity. This is also part of why I am making this section less prominent than it might otherwise be. I think this especially important to remember given that groups will be penalized for honesty – ie people who are more likely to confess to sexual harassment, or people who are more willing to admit that certain behavior crosses the line.
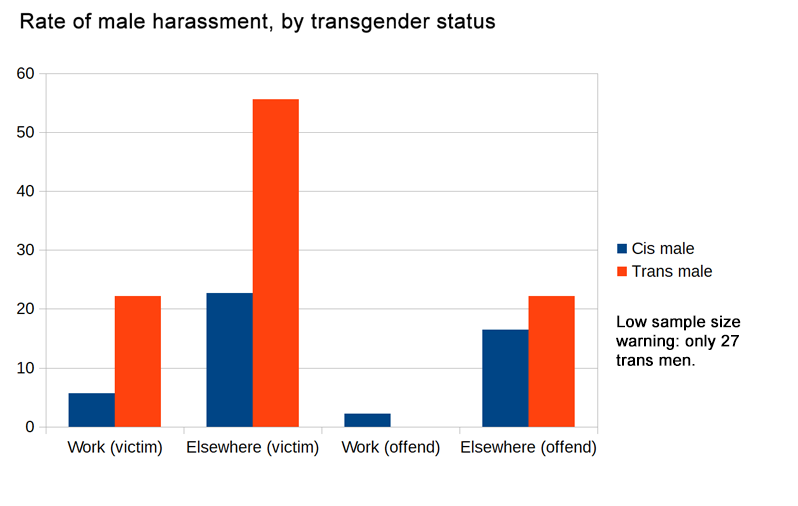
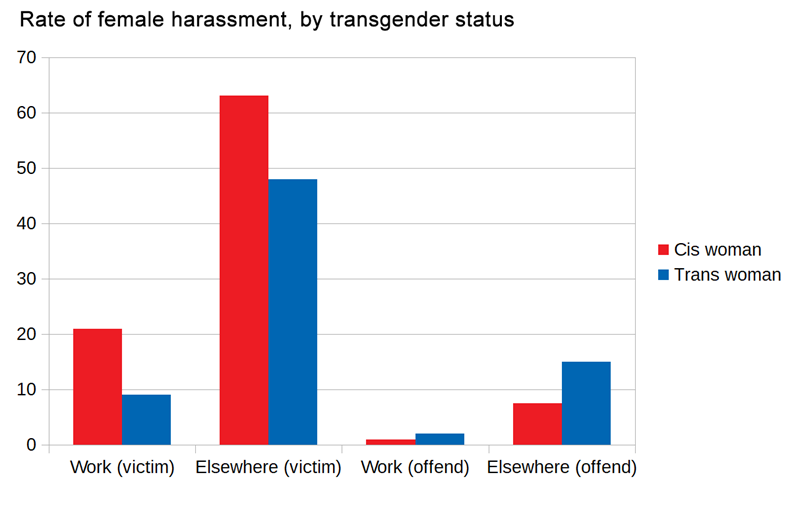
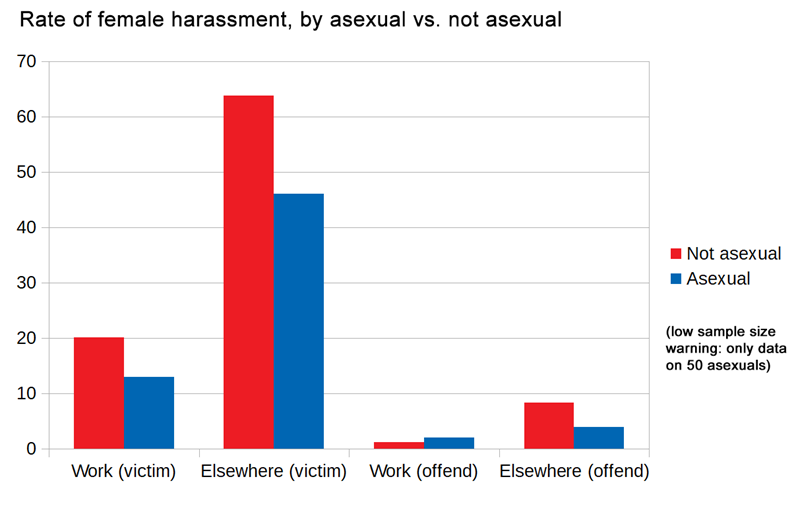
All analyses were limited to cisgender subjects except where stated otherwise. All analyses of women have a sample size around 600, all of men around 7000. Each subgroup has a sample size of at least 100 except where stated otherwise. Note that each graphic combines information on victimization and offending by one gender; offending results are often very low and slight variations should be taken with a grain of salt.
Rates by relationship status (male, female)
Rates by sexual orientation (male, female)
Rates by transgender status (male, female)
Rates by asexual vs. sexual (male, female)
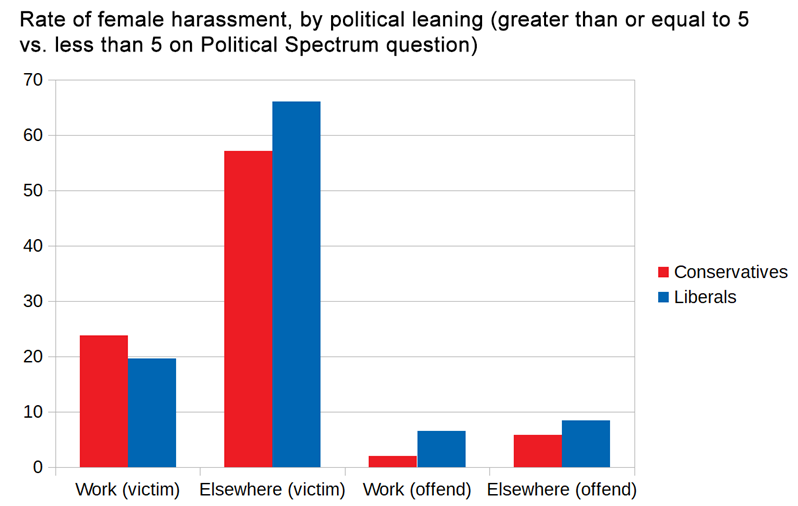
Rates by political affilitation (male) [not enough data for full female analysis, but binary left/right graph here]
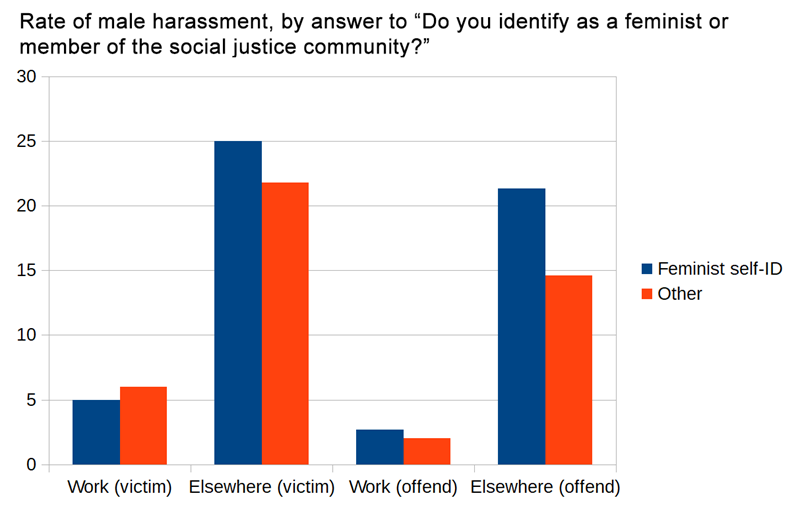
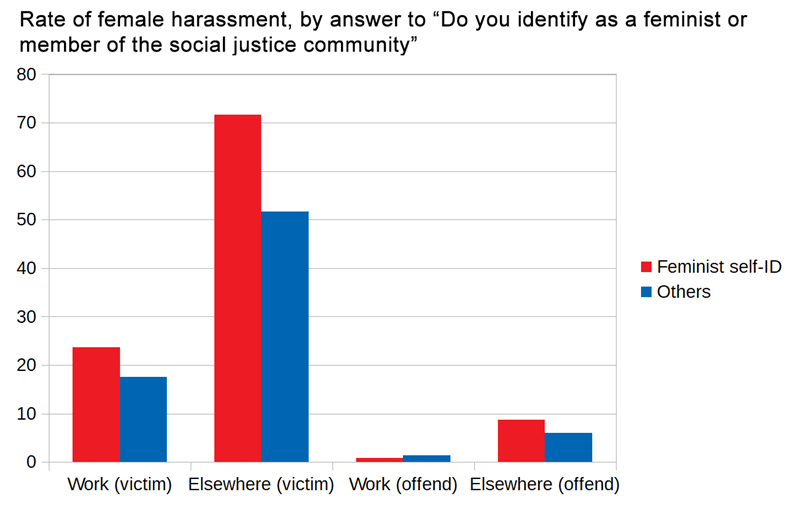
Rates by feminist self-identification (male, female)
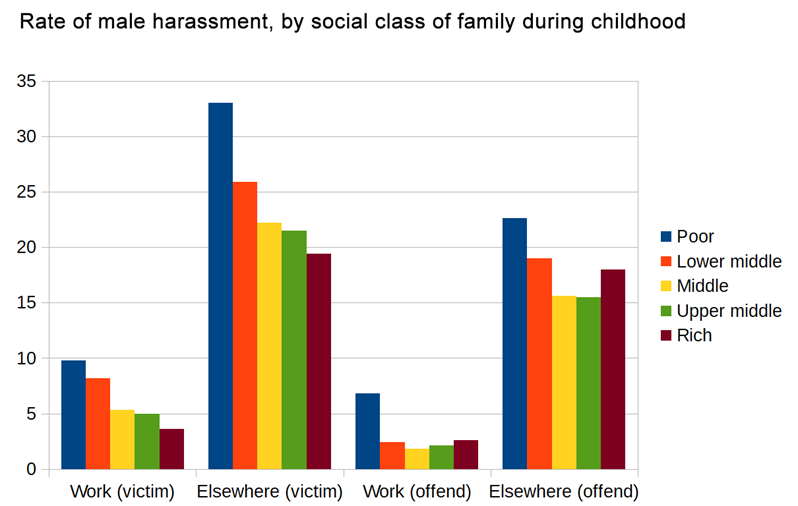
Rates by social class of family of origin (male, female)
If you want to analyze this further or double-check any of my results, you can download the raw data here.